The ABS released employment statistics for May last week and the numbers point to continued weakness in the labour market.
The headline you would have read/heard was that the unemployment rate declined. It’s true, it did decline. But that single data point hides the real state of the labour market.
Firstly, the key points for May;
-
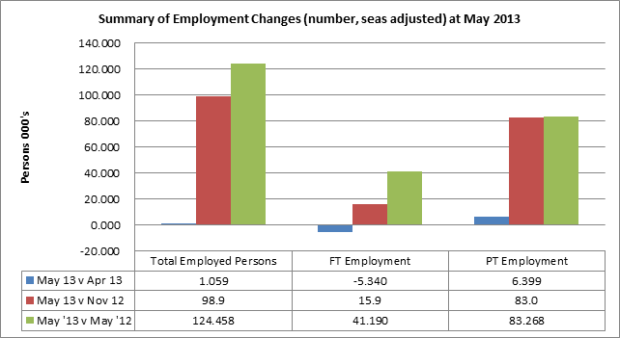
Total employed persons grew by a rather small 1.059k persons (seas adjusted). What drove this result was +6.4k in new PT jobs, which off-set a -5.3k decline in FT jobs.
- Total unemployed persons actually declined by -3.6k persons (this is positive) – most of this was the reduction in those looking for PT work -6k, but we saw an increase of +2.6k persons looking for FT roles.
- As a result, there was a -2.5k decline in the size of the labour force (the +1.059k growth in employed persons plus the -3.6k in unemployed persons). The decline in unemployed persons was larger than the decline in the labour force size, hence the unemployment rate declined.
-
The unemployment rate declined from 5.56% (April) to 5.53% (May). Hmmm.
Total Employed
I think the chart below does a good job to highlight one of the key weaknesses now facing our labour market and the economy – the shift to PT jobs. The majority of new jobs created over the last month, six months and year has been PT in nature. In fact, over the last year, 66% of the growth in employed persons has been PT and that number rises to 84% on a six month basis.
 Source: ABS
The annual growth in employed persons now sits at +124k. For many people reading this, you might think that sounds pretty good. How can growth of +124k in total employed persons in a year be a bad thing? It’s definitely not bad but current employment growth is well below trend. Over the last ten years, the May average growth in total employed persons was +231k. The current rate of growth is roughly half that. The chart below provides the long term growth (in 000’s of persons) – I’ve circled this current period of low growth.
 Source: ABS
Part Time Employed
Underneath these numbers have been some interesting shifts. As mentioned above, the key one being the shift towards PT employed. At the on-set of the GFC we saw a sharp rise in the ratio of PT jobs to total employed (below), reaching a high of 30.2%. Whilst that ratio looked like it was drifting down after the initial fear of the GFC subsided, it has now reached that same ratio of 30.2% of PT jobs to total employed. This ratio has started to move higher since Oct 2012:
 Source: ABS
Conversely, we have seen the lowest proportion of FT jobs to total employed, equalling the lowest recorded share of 69.8%. This is the lowest % share since records were started in 1978. As a proportion of total employed, PT jobs have grown consistently over the last 40 years or so. A big part of this was due to the increase of two parents in the workforce.
It’s actually interesting the growth in PT employed doesn’t consistently mirror the business cycle the way that growth in total persons employed does.
 Source: ABS
In fact, during the GFC, total PT employed actually grew. Growth in PT employment continues to be strong (on trend, at least) – the annual rate of growth in PT employed in May was +83k compared to the 10 year average for May – which was +86k.
Full Time Employed
If PT employment has been growing just on trend, then it means that FT employed has been growing well below trend.
 Source: ABS
When you look at the growth in FT employed (chart above), you start to see just how severe the impact of the GFC was on FT jobs – the decline was worse than the downturn of 2001 and almost on par with the recession of the early 80’s. At May 2013 annual FT employed grew by +41.1k – which is well below the average growth for May over the last ten years of +145k FT employed. The current growth is only 28% of the last ten year average.
The most obvious implication of a growing proportion of PT to FT employed is lower income. Whilst gaining PT jobs is better than no employment growth at all, the bills and the mortgage still need to be paid. Lower income impacts discretionary spending as well as a household’s ability to take on (more) debt.
Unemployment
The picture of total unemployed persons looked a little better this month with a -3.6k decline in total unemployed persons.
 Source: ABS
There was an increase in unemployed persons looking for FT jobs, but that was off-set by an even bigger decrease in those unemployed looking for PT work. This worked in favour of the labour market this month. But when you look at the annual growth (May ’13 v May ’12) in unemployment, growth in FT unemployed (+73.2k) far outweighs the decline in PT unemployed (-18.5k). In all, there has been a consistent increase in the total unemployed of +54k. The average growth for May over the last ten years has been a +0.4k increase in total unemployed, which means unemployed persons is growing well above trend, driven by an increase in FT unemployment.
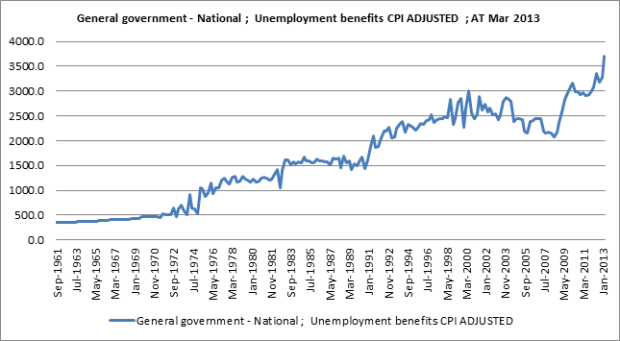
The National accounts were out a few weeks ago and another way to gauge the strength or weakness of the labour market is to look at total unemployment benefits paid out. After adjusting for the CPI, there was a 21% increase in unemployment benefits paid in Mar qtr 2013 v Mar qtr 2012 and a 13% increase versus the prior quarter.
 Source: ABS
This is a fairly large increase in unemployment benefits paid out, suggesting continued weakness in the labour market. I will also double check to see if this increase reflects any changes to the policy or to benefits.
Hours Worked
In previous posts, I’ve looked at the growth in hours worked. This seems to be a useful barometer of how the labour market and economy generally, is faring. I have made the observation that during past recessions/downturns, growth in PT hour accelerates and growth in FT hours slows down (usually declines) – where the red & blue lines diverge.
A similar trend could be starting to emerge. So far, we are seeing higher growth in PT hours (red line) and growth in FT hours at zero (blue line, year on year basis, trend data). On a month on month basis, FT hours have declined slightly.
 Source: ABS
Employment by State
The other issue facing the labour market is the slowdown in mining investment – namely impacting employment in WA. For the last several years, WA and the mining investment boom has been one of the larger contributors to National employment growth. Employment growth in WA is now starting to slow down. The chart below looks at growth in employment for the last year and the year prior.
 Source: ABS
In the previous year May 2012 v May 2011, WA accounted for a disproportionate 35% share of the total employment growth (blue bars). Note that the growth numbers here are slightly different to charts above (+126.9k v +124.1k) as I am using original data (only data available by state). In the latest year May ’13 v May ’12, WA now accounts for 12% share of National employment growth – which is more in line with its National share of total employed. Luckily, employment growth in NSW has remained strong.
Conversely, we are also starting to see a jump in unemployment in WA.
 Source: ABS
In the previous year May ’12 v May ’11, unemployment in WA was actually declining (blue bars). In the space of one year, WA has now become the second largest contributor to total unemployment, with unemployment growth of +16.5k.
Although VIC and QLD saw lower total employment growth, these states are also seeing lower growth in unemployment. The biggest market, NSW, has seen the strongest growth in both employment & unemployment.
Overall
So despite a very slight decline in the unemployment rate for the month, weakness remains in the labour market. The main point of this employment update is that as the economy slows down, we are seeing higher growth in PT employment than FT employment. Admittedly, growth in PT is better than no employment growth at all, but this shift may start to impact income and spending down the track. We are also starting to see the shift from the mining investment boom (which turned out to be labour-intensive) adversely impact the employment numbers and this will no doubt have a wide ranging impact on the economy.
