There have been two recent indications that we could see some weakness in our external sector when September 2014 GDP is released in a few weeks. Firstly, a continued unfavourable mix of import and export price changes in the Sept quarter point to further declines in our Terms of Trade (ToT). This provides an important indication of continued slower National income growth in the Sept quarter. Secondly, net exports look like it will only make a small positive contribution to overall GDP growth in the Sept quarter according to the latest monthly trade data. Growth in Australian National income and output during the 2000’s has been due, in no small part, to the ToT and the resources investment boom. But as the commodity cycle transitions from the investment to the production and export phase, National income growth has slowed and the degree to which export growth will outweigh the decline in project investment is now unclear. The transition is so far looking bumpy due to falls in commodity prices and what appears to be slower growth in China right at the time that production and export supply from these major resource projects starts to come online.
Import and Export Price Indexes
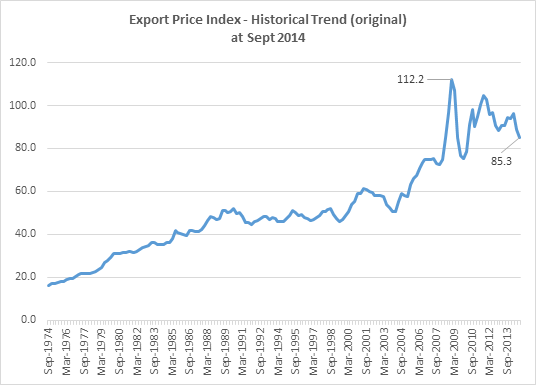
The release of import and export price data for Sept indicates further declines in the ToT when the National Accounts data for the September quarter is released in early December. The Import and Export Price Index (IPI and EPI) does not use the same methodology to measure import and export prices as the ToT index, but the EPI and IPI provides a fairly good indicator of what the National Accounts will show for the ToT in December. Directionally, the two have moved in sync.
The main highlight is that Export Price Index (EPI) for the Sept quarter continued to fall faster than the Import Price Index (IPI), albeit at a slower rate than the quarter prior:
- Export prices declined by -3.5% for the Sept qtr, but were down -7.9% in the previous June qtr – therefore Sept was not quite as severe
From an annual perspective, export prices have now declined in three out of the last four quarters, hence the large increase in the annual rate of change:-
-
Export prices have declined by -9.5% for the year to the end of the Sept qtr. The annual change was -1.9% at the previous June qtr 2014
The EPI peaked back in Dec 2008 and the index is now 24% below that peak. In the last 3 years, the EPI is down -18.3%.
Source: ABS
Export price indexes by major export have declined in most cases, with the exception of Gas.
New index weights were applied in Sept 2014 based on export size. Our top five exports represent 64% of total goods exports as at Sept 2014 – Metalliferous Ores 33.24%, Coal, Coke & briquettes 14.38%, Gas, Natural & Manufactured 7.05%, Gold non-monetary (ex gold ores & concentrates) 5.37% and Petroleum, petroleum products and related materials 4.5%.
Export prices in four out of the top five exports declined in the quarter, adding further to annual (and longer term) price declines.
 Source: ABS
The exception for the moment is Gas. Export prices for LNG continue to rise, likely still a function of a reasonably tight global market. The development of LNG projects are at a slightly different stage than Iron Ore.

Source: ABS
Investment in new LNG capacity has been part of the growth in resources investment and there are at least six (6) major Australian projects (as well as US, Indonesian and Malaysian projects) due to come online from 2015, adding further volume to total Australian exports and likely adding downward pressure to prices at the same time. It’s unclear the degree to which growth in LNG exports will off-set the decline in project investment spending – an important consideration when thinking about the impact on local aggregate demand.
Some relevant points from the BREE Sept 2014 update:-
“Over the medium term, Australian gas production will more than double. This growth will be underpinned by Australian LNG production which, in concert with rising Chinese gas consumption, will result in a much larger global LNG market by 2019. Supply growth and lower oil prices will also place downward pressure on LNG prices.”
“The growth in Australia’s exports over the period to 2019, underpinned by 61.8 million tonnes a year of new capacity, greatly alters the Asia-Pacific LNG market and is expected to make Australia the world’s largest LNG exporter by 2019.”
“A growing US LNG export sector would increase liquidity in what is currently a very tight global market. This would in turn depress spot prices and place longer term pressure on contract pricing and the mechanisms under which contracts are negotiated.”
Monthly Balance of Trade – September (seasonally adjusted)
Trade data released for September points to only a small positive contribution to nominal GDP growth from net exports in the September quarter.

Source: ABS
Net exports in the June quarter GDP (current prices) was -$4,691m, a large negative turnaround from the +$2,566 net exports figure of the March 2014 qtr. Based on the monthly trade data (which is revised each month as more data becomes available), the current estimate for the Sept quarter is approx. +0.04% pt contribution to GDP growth for the quarter (using the net exports data at current prices from the National Accounts 5206.03 until June 2014). The annual contribution will not be favourable at this current rate either. As mentioned, the trade data is provided monthly and tends to be revised the following month, so should be considered as an estimate until GDP is released.
What made the current quarterly change slightly positive was the fact that, despite lower exports of goods & services of -$621m, imports also slowed in the quarter and are so far estimated to be $984m lower than in the previous quarter. Had imports increased/grown versus the June qtr, then the trade balance would have been worse (and likely detracted from GDP growth) given the quarter on quarter decline in nominal exports.
The contributor to the decline in exports was within the ‘Goods/Merchandise’ category. But in order to drill down into the detail, you need to look at data that is not directly comparable – Merchandise Exports by SITC classification using original data, not seasonally adjusted data. The ‘original’ data paints a much more positive view of the status of our goods exports. Using the original data, goods exports grew by 1.68%, rather than the decline of -1.1% that the seasonally adjusted data indicates.
Using the more positive data still highlights that our single biggest export group, Metalliferous ores (28), likely only made a small contribution to overall nominal export growth for the quarter. This is somewhat concerning given that projects are starting to come online and haven’t cycled a full year yet.
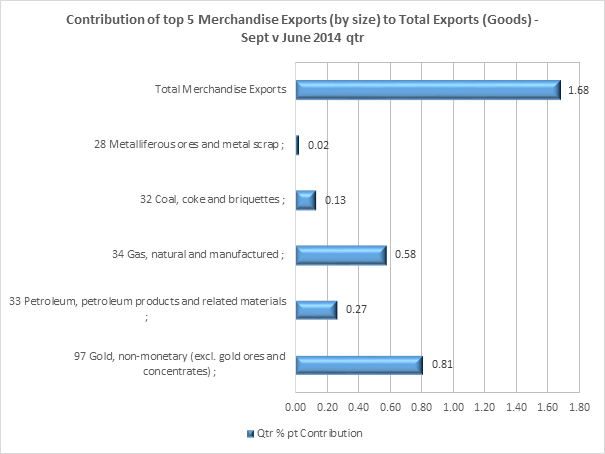
Source: ABS 5368.12a
From BREE:
“Iron ore volumes are forecast to increase by 13 per cent in 2014-15, underpinned by a full year of production by recently started mines. However, earnings from iron ore are forecast to decline by 4 per cent because of forecast lower prices.” Source: BREE Sept 2014 Update
On a more positive note, the month on month trend may be highlighting a turnaround in iron ore exports, with the last three months showing improvement in the trend at least.

Source: ABS
With further falls in the ToT likely, National income growth will remain low. The monthly trade data suggests that net exports, despite major mining export projects coming online, may not provide the impetus for higher nominal GDP growth in the quarter. We’ll now have to wait and see what the National Accounts look like in early December.
