In a recent post (They say we’re in an “income recession”), I highlighted the potential for a negative impact on the labour market due to falling National income. The fall in National income has been primarily driven by falls in profit of the corporate non-financial sector (mostly mining).
“After 3 consecutive quarters of declining company profits, corporates will be under pressure to continue to cut costs. It’s unlikely that the corporate sector will just continue to absorb these falls. The immediate risk is to the labour market and compensation of employees.”
It may take time for this to play out, if indeed it does, but this is important context for looking at the performance of the labour market.
It’s fair to say that the Australian labour market has lost its growth momentum during 2015. It’s not visible looking at the annual figures, but it’s there in the more recent monthly trends which is what I will focus on in this post.
During the first half of 2015, growth in the majority of labour market performance indicators started to slow. Given the shift in employment growth, growth in hours worked has followed a similar trend, but not quite to the same degree – this is an important indicator of domestic economic activity. The resilience of the labour market over the last 18 months or so has provided a base for growth. As long as the labour market holds up, the economy will, in all likelihood, be OK. There is evidence here to suggest that the labour market is starting to slow. Within the context of other economic indicators, such as falling National income, this is not surprising.
There has been a lot of noise about the validity of the labour market reports over the last several years. As usual, I have used the “trend” data series (as opposed to seasonally adjusted or original), which means that from month to month, the data can shift around somewhat. But even though there have been some large revisions to the data during 2015, the major trends have remained intact.
Employment growth is slowing
The main trend that has been consistent throughout the year, is that employment growth has been slowing. To be clear, employment is still growing, it’s growing at a decreasing rate.
Employment growth peaked in February 2015 and has slowed since then, more so for FT (full-time) employment growth.

Source: ABS
Since July 2015, the labour market is now back to the point where PT (part-time) employment growth is exceeding FT employment growth. Monthly employment growth has almost halved since Feb 2015.
On an annual basis (chart below), this slow-down is not yet visible. The annual growth is still recording new recent highs in employment growth of +232k persons for the full year to Sept 2015.

Source: ABS
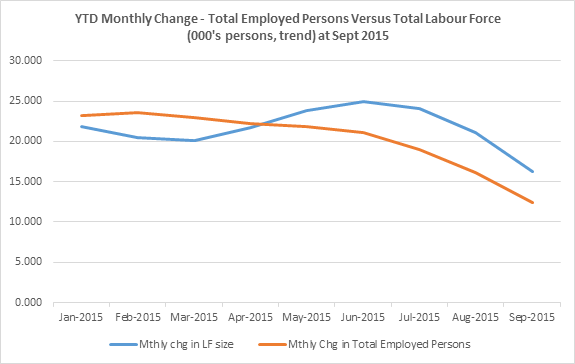
Unfortunately, even this higher level of annual employment growth is not enough to make a dint in reducing the total number of unemployed persons. As of Sept 2015, growth in total employed persons is still below that of the labour force. This trend has been in place for the most part since the start of 2011:-

Source: ABS, The Macroeconomic Project
Total number of unemployed persons growing again on a monthly basis – now at 780k persons
As a result, unemployment is still growing. Annual growth in total unemployed persons has reached new lows, but is still growing on an annual basis by +16k persons.

Source: ABS
The more concerning part of this trend is that on the month to month basis, growth in total unemployed persons has been increasing again since Feb 2015. Growth in unemployment has slowed slightly in the last 2 months.

Source: ABS
So how can both unemployment and employment growth slow at the same time in the last two months?
At first sight, the slow-down in unemployment growth during Aug and Sept looks to be positive, but it’s more likely a function of employment growth that is slowing less than the labour force growth (in absolute numbers).
The slowing growth in the labour force can be explained by both slowing population growth and slowing growth from improving participation rates over the last three months:-

Source: ABS, The Macroeconomic Project
For example, between July and Sept 2015, growth in the labour force slowed from +24k to +16k persons (a slow-down in growth of approx. -8k persons). I’ve used July because that also coincides with the recent peak in unemployment growth. At the same time, growth in employed persons slowed from +19k to +12k persons (approx. -7k). This means that monthly growth in unemployed persons slowed from +5k to +4k (approx. -1k). This way of looking at the data assumes that unemployment is the outcome when employment growth is lower than labour force growth.
The chart below shows how this dynamic is playing out – slowing labour force growth is likely making the unemployment situation look slightly better.
Source: ABS
The difference between the blue line (labour force growth) and the orange line (employment growth) is the growth in unemployed persons (when the labour force growth is > employment growth). That gap narrowed in the latest month because the labour force growth slowed by a slightly larger number of persons than employment growth.
This chart also highlights that the overall dynamic of the market is negative – it’s based on slowing growth. To be confident that the economy is growing strongly enough to reduce unemployment, employment growth should be accelerating and be above labour force growth – we aren’t seeing that happen at the moment.
The situation is slightly different when you look at the gender split.
Growth in total employed females has only just recently peaked in June 2015. Throughout the early part of 2015, female employment growth was accelerating and growth in total unemployed females was also accelerating. Part of the reason for that was the fairly significant increase in female participation adding workers back into the female labour force at a rate faster than the accelerating employment growth. This seemed like the kind of situation you would expect to see in an improving labour market.

Source: ABS, The Macroeconomic Project
Female participation has now reached all-time highs in Sept 2015. But since June 2015, the female participation rate has started growing at a decreasing rate. This, together with the slow-down in employment growth, means that growth in unemployment is also slowing (a similar dynamic as above).
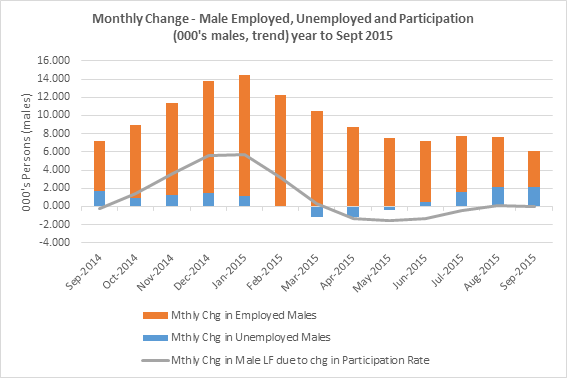
Males, on the other hand, have not been faring well in the labour market.
Employment growth for males has slowed throughout the year from +13k in January 2015 to +4k in Sept 2015.
Whilst growth in the male labour force has also slowed throughout 2015 (-8.2k males between Jan and Sept 2015), employment growth has slowed by a larger number (-9.2k males). As a result, the monthly growth in unemployed males has increased from +1k/month to over +2k males in Sept 2015. There was a brief time when male unemployed persons actually fell month on month, whilst employment growth was slowing.
Source: ABS, The Macroeconomic Project
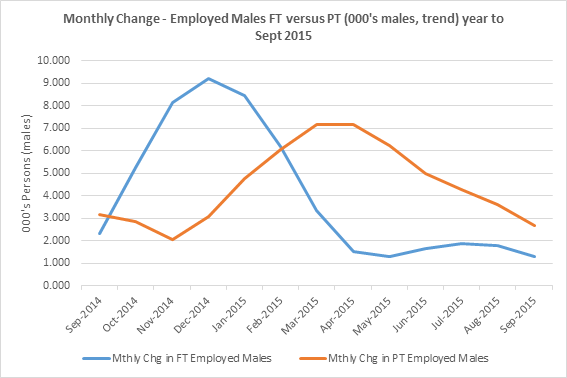
The trend for male employment growth in the short-term also looks poor. For the year, employed males grew by +105k persons (+50k FT and +55k PT). Most of this growth came early in the year and employment growth for males appears to have slowed across both FT and PT employment in recent months:-
Source: ABS
Growth in male FT employed persons has now slowed to just above 1,000 persons in the latest month, down from over +9k in Dec 2014.
“Hours worked” mirrors the employment growth trends
Ultimately, growth in hours worked is an important benchmark to understand changes in activity in the domestic economy.
Total hours worked for Sept 2015 were 2% higher than for the same time in the prior year. This is a high point for the annual % growth in hours worked since mid-2012.

Source: ABS
Over the course of the last 12 months though, the trend in growth of hours worked month to month, does seem to mirror that of employment growth, but not quite to the same degree.

Source: ABS
Monthly growth in hours worked has slowed throughout the year, as with employment growth. But over the last 3 months to Sept 2015, that rate of growth picked up somewhat from 0.31% to 0.36%. This growth in hours worked in the last 3 months (versus the 3 months prior) was driven by only two states – NSW & TAS, but mostly NSW.

Source: ABS, The Macroeconomic Project
This is a big shift compared to the larger number of states that contributed to growth in hours worked on an annual basis (NSW, VIC, QLD, SA, WA, TAS and NT).
What the quarterly data doesn’t show is the recent improvement in hours worked in QLD and, at least a slow-down in the rate of decline in hours worked in SA. The monthly trend also shows that the rate of growth in hours worked in NSW is slowing, but it’s still growing strongly enough to drive the National result. Apart from these exceptions, the contribution by state to growth in hours worked over the latest quarter (versus the quarter prior), is a fairly accurate representation showing a slow-down/decline in hours worked across a majority of states.
I will pick up some more detail in state by state trends in a separate post.
The overall picture of the labour force at September is one of weakening momentum. Employment growth has slowed throughout 2015, more so for males and crucially, FT employed persons. Unemployment has also started to grow again throughout 2015. The slow-down in unemployment growth over the last few months is more a result of slowing employment and labour market growth, rather than due to a material improvement in conditions.

One comment