The ABS has released its House Price Index for the Dec 2012 quarter.
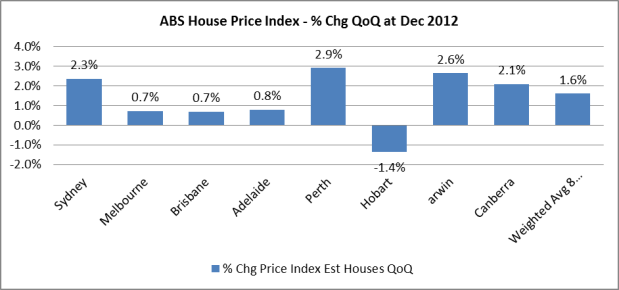
As expected, there was a reasonable bounce back in house prices in the last quarter of 2012 of +1.6% versus the prior quarter. The Sept 2012 qtr was revised lower in this round of data.
The Dec qtr was the strongest since the First Home Buyer-fuelled growth in house prices during 2009. The National House Price Index now sits at only 3% below its all-time high.
Source: ABS
Despite this solid result, there is still some weakness across the states, with only two ‘major’ states posting above national average gains in house prices – Sydney & Perth.
Source: ABS
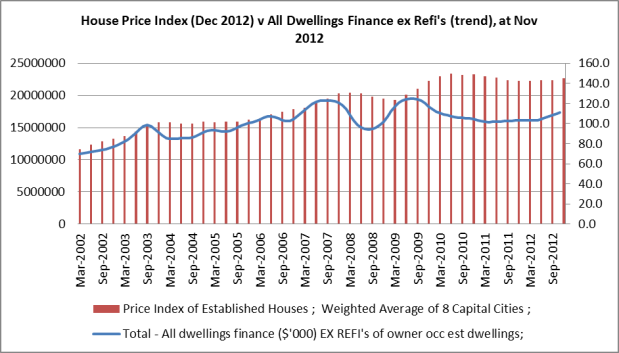
One of the key drivers of house price growth is the availability of & willingness to take on more debt, or accelerating credit. There has been growth in housing lending finance for quite a few months now. Although I haven’t proven a correlation between debt & house prices here, you can see that the two move together (it makes sense that they would).
Source: ABS
Growth in lending continues to hold up the housing market. Based on the current data, it appears that we aren’t going to see any movement down in house prices yet. Interestingly, we are currently 3% below the peak in house prices, and yet 11% below the peak in lending. Despite lower lending, prices remain high.
At Nov 2012, total housing lending has grown by over $10b (incl refi’s), or 4%, year on year. More specifically, its investment lending that is driving the growth in overall housing finance lending:
| $ Growth (MAT Nov 12 v MAT Nov 11) | Growth % | |
| All Dwellings Finance | $10,397,895,000 | +4.39% |
| Investment Housing Finance | $4,929,143,000 | +6.25% |
| All Owner Occ Finance Ex Refi’s | $2,822,5546,000 | +2.51% |
| Owner Occ Refi’s | $2,646,206,000 | +5.82% |
Source: ABS, seasonally adjusted
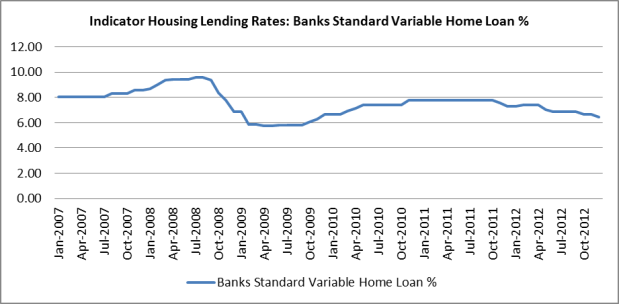
One of the key drivers for this growth in housing finance is likely to be the recent interest rate cuts. Since the end of 2011, the RBA has consistently cute rates in order to stimulate growth in lending.
Source: RBA
This appears to have had/is having the desired effect – on house prices anyway.
Investment Housing Finance
There has been a turnaround in investment housing finance since approx. Feb 2012. Since then, growth has spiked quite dramatically, especially after a period of low/flat growth throughout 2011.
Source: ABS
The rolling 12 month growth for investment housing lending is now in positive territory. Month on month for Nov 2012, it has grown by over 15.5%. Investment housing finance accounts for approx. 1/3 of total housing lending value.
Investment mortgage debt growth has been accelerating since late 2011. This is an important distinction when thinking about house prices.
Source: RBA, ABS, The Macroeconomic Project
Despite the accelerator being in negative territory throughout 2012, it has been moving in a positive direction, creating a stimulatory effect (growth in the growth of debt stock = credit is accelerating and the addition of new credit is what stimulates asset prices).
Unfortunately, this chart is a little backward looking (only up until Sept 2012, due to GDP lag). There has been a slight pullback in the accelerator in the latest month only (Sept ’12).
The recent up tick in the rate of growth in real investor mortgage lending suggests that the accelerator may continue to rise for the Dec 2012 quarter.
Source: RBA, ABS
My sense is that investors have responded to the interest rate cuts – just given the timing of rate cuts and the way in which credit growth has starting growing again. What would be really interesting to understand is how these investors are funding their purchases. Are they interest only loans? It would also be interesting to know what proportion are local v. overseas investors.
Owner Occupied Housing Finance
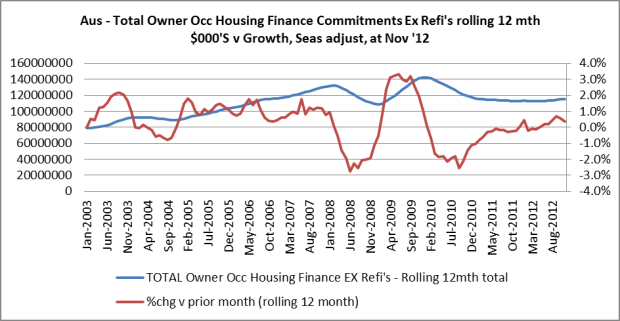
At first glance, it appears that owner occupiers are also helping to move house prices higher. Growth in credit has continued to improve and is now in positive territory (ex refi’s). The uptick in growth from Feb 2012 suggests that interest rate cuts have had some effect.
Source: ABS
It’s interesting to break down “owner occupier” lending activity into its parts to understand the picture a little better;
|
$ Growth (000’s) (Yr on Yr Nov ’12) |
Growth % |
Share % |
|
| All Dwellings Finance |
$10,397,895 |
+4.39% |
|
| Investment Housing Finance |
$4,929,143 |
+6.25% |
|
|
|
|
|
|
| All Owner Occ Finance Inc Refi’s |
$5,468,752 |
+3.46% |
100% |
| Owner Occ – Construction of Dwellings |
$640,511 |
+4.01% |
10.2% |
| Owner Occ – Purch of New Dwellings |
$1,030,421 |
+13.05% |
5.5% |
| Owner Occ – Purch of Other Est Dwellings |
$1,151,614 |
+1.3% |
55% |
| Owner Occ – Refi’s of Est Dwellings |
$2,646,206 |
+5.82% |
29.4% |
Source: ABS, seasonally adjusted
The biggest part of owner occupier lending is for the purchase of established dwellings – this activity has grown annually by far less than the average of all dwellings finance at only 1.3%. The growth in the ‘headline’ number for owner occupiers has equally come from the smaller segments – construction and purchase of new dwellings, as well as refinancing. The growth in lending for the purchase of new dwellings is mostly driven by changes to first home owner grant initiatives (mostly focusing on the purchase of newly constructed homes). Refinancing has also continued to grow, but note that this does not contribute to house price growth – no sale transaction has actually occurred.
The main point is that single biggest part of the market, owner occupiers purchasing established dwellings, is growing at the lowest rate of growth.
The acceleration of debt for owner occupiers shows a very different pattern to that of investor lending. Broadly speaking, owner occupier lending is growing, but that growth has been reasonably constant (relative to the size of GDP) over the last year, so its potentially not stimulating house price growth in the same way that investor borrowing is.
Source: ABS
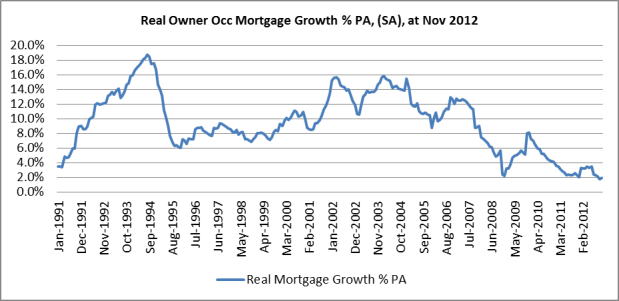
Again, we are lagging in this data above due to GDP data. But the growth in real owner occ lending (up until Nov ’12), suggests that we’ll see a further weakness in the credit accelerator for owner occupiers. The rate of growth in real owner occupier lending continues to slow down – its now reached a low of 1.9% and is on its lows.
Source: RBA, ABS, The Macroeconomic Project
Whilst growth for both investor and owner occupier housing lending has been slowing down, total mortgage debt outstanding as a % of GDP is still close to its highs – currently 84.5% versus the Mar 2010 high of 87.2%.
Source: RBA, ABS
On the whole, I would argue that interest rate cuts have been less successful in stimulating demand for more debt for owner occupiers buying established dwellings. This could differ slightly on a state by state basis.
Owner occupiers, excluding new home/construction lending, have not/are not participating to the same degree as investors in this ‘interest rate cut rally’. Housing investors appear to have taken advantage of lower interest rates to buy properties and this has been helping to drive house prices higher.
Credit Accelerators – Other Sectors
Further results of the credit accelerator calculations suggest that interest rate cuts have also done little to stimulate the credit impulse in the broader economy.
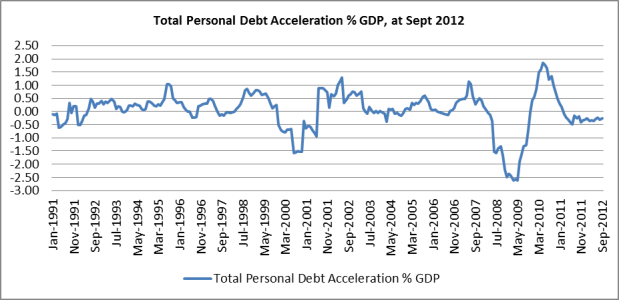
The personal debt credit impulse remains in neutral.
Source: RBA, ABS
Although, the latest month of real personal credit growth (Nov ’12) suggests that there could be some improvement in the accelerator during the last qtr of 2012.
Source: RBA, ABS, The Macroeconomic Project
This level of declining real personal credit suggests that consumers, on the whole, have been cutting back. This personal debt is being paid down at a pretty constant rate, which is consistent with the zero credit impulse. Personal debt to GDP has continued to fall since late 2007.
Source: RBA, ABS
It appears that consumers have taken advantage of interest rate cuts (via an increase in disposable income) to pay down their personal debt, rather than take on more debt. We are seeing some of this weakness show up in areas of spending such as retail sales. But they are barely making inroads into paying down their mortgage debt.
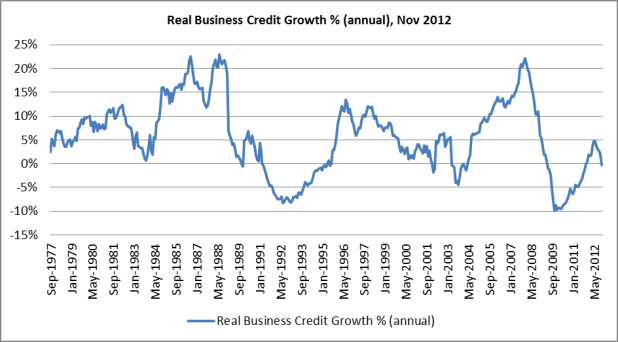
Of a larger concern is the change in the business credit impulse. This is quite a ‘noisy’ data set, but I think it shows a further slowdown in business lending/borrowing. If you consider that new credit issued=new spending in the economy, then a fall in new credit issued will/should correlate to a fall in spending. This is bad news for the economy and speaks volumes about the real state of business confidence. Consider that this is happening with a backdrop of low interest rates.
Source: RBA, ABS, The Macroeconomic Project
The growth in real business credit further suggests that the business credit accelerator will continue its decline into the last quarter of 2012.
Source: RBA, ABS
Growth in business debt in real terms has gone from 5% in June 2012 to zero % in Nov 2012. Business in Australia (I’m referring to manufacturing & retailing) has been struggling with high exchange rates and competition with cheaper overseas imports & online retailers. The pull back in debt acceleration suggests that business are preparing to further slow their growth and are becoming more uncertain or unwilling to take on debt to fund investment or expansion. This may not bode well for future employment & income growth.
Just to put this into perspective, business debt outstanding has fallen since the GFC, but has stabilised at around 50% of GDP. So in relative terms, this is an important group from the perspective of stimulating spending & growth in the economy.
Source: RBA, ABS
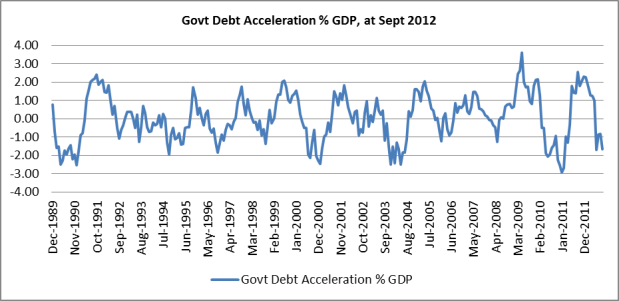
The government credit impulse is also cause for concern – in the sense that it is moving down and not stimulating spending/income. I’m not suggesting that the government should be deficit spending at this stage.
Source: RBA, ABS, The Macroeconomic Project
The credit impulse for government has trended down since mid-2011. There has been a further pull-back in new credit/spending by the government (no big news there given we had a government committed to a budget surplus) in the most recent data. This is also evident in the real government credit growth rate.
Source: RBA, ABS
Only the government sector has grown debt to GDP in the last few years – in an effort to stimulate our economy during the GFC. At less than 10% of GDP, government debt is still quite low.
Source: RBA, ABS
Overall, I think the credit impulse data is pointing to a potential slow-down in the Australian economy. Interest rate cuts have not stimulated the credit impulse for owner occupiers, personal lending or business lending – at least not in the same way as the investor housing credit impulse. Without growth in the credit impulse, its not likely we’ll see growth in spending in the economy.

