The GDP result for the September quarter came in ‘better than expected’. In real terms, the economy grew by 0.9% in the Sept qtr and +2.5% for the year. This is historically low growth, but given the scope of the adjustment currently underway in the Australian economy, it’s not a bad result.
This is a case though where the ‘better than expected’ top-line result isn’t representative of the underlying performance. Our latest growth figures were mostly the result of an unusually high contribution from net exports in the quarter. Investment spending continues to fall and household consumption spending was at best, on par with previous results and not really trending either way. The less-worse National income figures were due to Terms of Trade that didn’t decline as much in the Sept quarter.
Indicators of domestic activity show that the economy is continuing to languish. One measure of domestic activity known as Gross National Expenditure or GNE (which is just adding up the contribution of all consumption spending, investment spending and inventories), shows that growth was negative in the latest quarter:-

Source: ABS
There are several important points about the September quarter results.
Net exports made an unusually high quarterly contribution to GDP growth
…and the question is whether this latest quarter of net export contribution can be sustained. The analysis below is based on chain volume measures ie removing price effects. The situation would look different if you looked at nominal results.
The size of net exports in the Sept quarter was unusually large and was the combination of two factors 1) larger-than-normal growth in exports and 2) a corresponding contraction in imports.
To provide some historical context – the contribution of net exports to real GDP growth in the Sept 2015 qtr (last orange bar) was the fourth largest quarterly contribution since the start of this data series:-

Source: ABS
The chart above suggests that these ‘blowout’ quarters are infrequent, but not impossible, events. Net exports have been making a larger contribution to GDP growth since 2010.
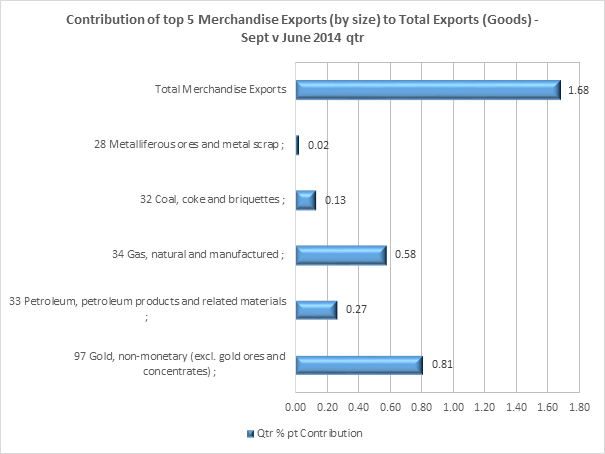
Exports – Of the $4b growth in exports for the quarter, $3.9b of that was due to growth in goods exports. The biggest contributors to growth in goods exports for the quarter were non-monetary gold ($2.36b), metal ores ($1.24b) and then coal ($0.9b), in real terms. So actually, the largest contributor to our export growth for the quarter had nothing to do with mining. The size of the Sept quarter export growth for non-monetary gold was unusually large. But all it represented was a return to a fairly normal level of exports – it was actually the previous quarter fall that looks like the anomaly.
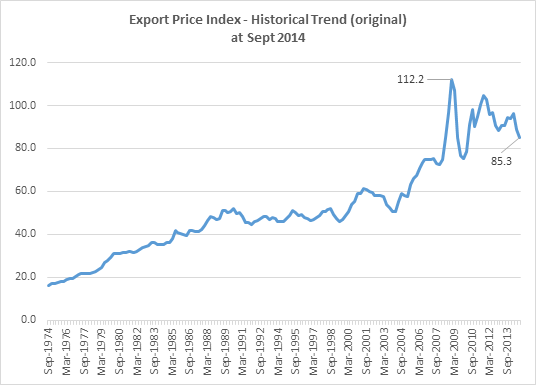
While there has been a slow-down in growth of our largest export, metal ores & minerals, volumes are still at all-time highs. The current level of contribution to growth is actually above just above average. At the time of writing, iron ore spot prices have now fallen below US$40/mt. The ongoing fall in prices is likely to result in a shake-out among higher cost producers, but the impact on our export volumes will be dependent on how low prices fall and how much Chinese economic growth slows (our largest export market). By all accounts, growth in China is expected to slow in 2016 and this will likely have adverse effects on our exports.
Despite the higher growth in the latest quarter, annual growth in coal exports have been negative over the last two quarters.
A significantly smaller amount of our export growth, $140m, was attributed to growth in services exports in real terms (source: ABS 5302.06). Growth in service exports have slowed in the last two quarters. There is no doubt that the growth in services exports has benefitted from the falling AUD, but the size of the sector for the moment is still small – approx. 20% of overall exports (in real terms). There is still much work required to further develop our service export industries and the Productivity Commission released a draft paper in August 2015 “Barriers to Growth in Services Exports” outlining the barriers and potential remedies.
It’s likely that we will continue to see higher than average contribution from exports (in real terms) to GDP growth in the near term, maybe just not to the same degree as this quarter.
Imports – Imports contracted by over $2b in real terms for the quarter. This is now not an unusual event, but the recent trend is somewhat unprecedented in the history of the data.
Goods imports peaked in June 2012 and are now 2% below that peak. Service imports peaked later in June 2013 – and are now 16% below that peak.

Source: ABS
Most of the decline in services imports can likely be attributed to the falling AUD. Since Sept 2013, price deflators (price index) for service imports increased by over 24% versus the Sept qtr 2015. The average quarterly change in the import price index during this time was +8%.
Not all of the decline in the import of goods can be attributed to the effect of the fall in currency. The import price deflator for goods also increased, but to a lesser degree averaging 2.3% since June 2012 (which is roughly around CPI levels). The areas that have contributed to the slowing in the import of goods is the area of capital goods. Since mid-2012, the import of capital goods has contracted by over 26%. This is mostly the result of the decline in mining investment spending, but is not limited to mining.
In the latest quarter, the largest part of this contraction was lower imports of Intermediate and Other Merchandise Goods for groups such as processed industrial supplies, iron & steel, lubricants and other parts for capital goods. While this could be just a quarterly aberration, there is an important point to this. What sits in these groups are inputs for industries such as car manufacturing. As this industry in particular starts to wind down in Australia, lower imports here could start to become the norm (but will be replaced by imports of finished product).
Demand for imported consumption goods continues to grow – food & beverage, household electrical, non-industrial transport (cars), textiles, clothing, footwear, and toys, books and leisure goods all grew in the latest quarter. Annual growth of imports of consumption goods is over 10%.
It may not be so unusual now to see further declines in imports and this will add to net exports.
Taking a step back though, the theory is that net exports are supposed to take over from where the mining investment boom left off. But it’s not likely that the spoils of an export boom are shared throughout the economy in the same way as an investment boom. Think wages, prices, employment, investment – all of these have been falling as we’ve moved into the more volume, cost and efficiency focused phase of the mining boom. The export boom still supports some level of local employment, government revenue and mostly corporate profits. But this is highly dependent on commodity prices. The Sept quarter was essentially a breather from the more aggressive falls in our major commodity prices – iron ore, coal (bulk commodity prices) and oil. The falls have now continued on in earnest – this will be reflected in the Dec data.
The decline in mining capex spending isn’t being offset by other investment spending
There has been a narrative that the housing construction boom can and will fill the gap left by mining investment.
As of the latest quarter, private dwelling investment spending contributed +0.5% pts to annual real GDP growth, whereas total private business investment detracted -1.5%pts from annual real GDP growth.

Source: ABS
Housing construction has at least taken up some of the slack left by lower mining investment, especially for employment.
According to GDP figures, we are well and truly into the housing construction ‘boom’. Currently, dwelling investment spending, including alterations and additions, is growing at over 10%:-

Source: ABS
In historical terms, this level of growth is just above average, but it has been accelerating since 2012.
There are many factors that weigh against the ongoing growth in the housing construction boom. Household debt (mortgages) is already at all-time highs, banks are tightening lending standards, negative wage growth, likely lower demand from foreign investors, slowing population growth and interest rates that have little room to power further growth. On the plus side, with prices starting to cool in some parts of the country, it could start to encourage those who have been priced out of the market (FHB’s).
There is no evidence to suggest that the growth generated by dwelling investment spending is or will be remotely close enough to filling the gap left by lower mining investment. It’s likely that we will continue to see further declines in overall investment spending. The latest capex survey highlighted that these declines were not limited to mining either. Manufacturing and services were also expected to see lower capex in the coming year. In fact the survey highlighted that some of the bigger falls in spending were to be expected from 2016, although the capex survey does tend to overstate the extent of capex changes.
Public sector activity lags
The falls in investment spending are not limited to the private sector, with public investment spending also detracting from GDP growth. The worrying element is the rhetoric of the new Treasurer who believes that we have a spending problem, not a revenue problem. It’s fully expected that the December MYEFO will highlight a further deterioration in the budget deficit and this will only add further pressure to the level of public spending.
Household consumption spending growth is trending along, but not accelerating
Household consumption spending is still the largest part of our GDP. Growth in household consumption spending has been fairly stable over the last year, but still well below the growth levels pre-GFC:-

Source: ABS
For the moment, household expenditure is neither accelerating nor decelerating. On an annual basis, the falls in investment spending (public & private gross fixed capital formation) were only just offset by growth in consumption spending – with GNE growing by 0.24%. But in the latest quarter, the growth in consumption spending, both public and private, is more than offset by the declines in investment spending resulting in GNE declining by 0.6% on a quarterly basis.
At least the slight improvement in Compensation of Employees in the last few quarters, and mortgage/house price growth, will continue to help underpin spending.
National income improved in the latest quarter
The analysis so far has focused on the economy in ‘real terms’ – removing the effect of price changes to understand the actual level of activity. But an important consideration is how much income we as a country generate from our productive activity. One of the more important determinants of our National income at the moment is movement in our terms of trade (ToT). As mentioned, the Sept quarter was a breather from the accelerating falls:-

Source: ABS
This is a slightly different view of movement in the ToT because I wanted to highlight that while the ToT still declined in the latest quarter, the level of that decline was smaller than in the June quarter. This was the result of more stable commodity prices during the September quarter.
Growth in the individual components of National income improved in the latest quarter, ‘saved’ partly by less-worse Terms of Trade falls and better labour market data. We still seem a long way from the income levels pre the ToT peak (2011):-

Source: ABS
Part of this recent improvement is not going to last, especially the improvement (or the less negative contribution) in the gross operating surplus of private non-financial corporations, given the ToT declines have continued to accelerate in the December quarter.
An interesting point is that Gross Mixed Income (GMI) is making a larger contribution to overall to income/nominal GDP growth and has been trending this way all year. “GMI” represents unincorporated enterprises. Could this be the result of a growing group of self-employed people?
What isn’t adding up is the labour market. The relationship between Gross National Expenditure and hours worked has a reasonable level of correlation over its history (r=0.65). In the last few quarters, growth of the two measures have diverged – hours worked continues to grow and GNE is slowing (in the quarterly data GNE is actually declining):-

Source: ABS
For the moment, labour market indicators show that the labour market is actually quite stable. Hopefully this means that GNE will follow hours worked.
As always, GDP is backward looking. As of early December, we are looking at renewed falls across commodity prices, continuing poor data out of China, a worsening budget situation and a housing market (Mel & Syd) that looks like it is starting to cool.


 Source: ABS