Credit data released by the RBA shows growth in Total Private Credit accelerating, as at March 2014.
This should be a positive sign for the economy – changes in spending in the economy depend on changes in income and changes in net new lending (source: http://www.debtdeflation.com). The components of this acceleration are also important indicators of where the economy may be headed and this is what I want to focus on in this post.
The main contributor to the acceleration in new credit continues to be investment housing credit. No surprise and no change. But the real news in this data is the ongoing turnaround in business credit. Whilst the size of the business credit impulse is still very small relative to the other credit components, it is now in positive territory. I’m far more enthusiastic about the improvement in the business credit impulse than the ongoing acceleration in housing credit growth. Schumpeter argues that there is a link between accelerating debt and accelerating incomes – if that debt has been used to fund entrepreneurial activity. In theory, that’s an investment in building the productive capacity of the economy, which is positive for growth in income and in employment. Certainly a part of the RBA’s intention with lowering interest rates has been to ‘rebalance’ investment towards the non-mining sectors. But business investment has been slow to respond and new credit for investment hasn’t grown on a large enough scale yet.
On the other hand, the change in monetary policy seemed to impact the speculative aspect of housing finance almost immediately. The majority of outstanding debt in Australia is related to housing and continued increases in house prices relies on accelerating housing lending/debt. Unfortunately, a large share of growth in new credit, and growth in household debt, continues to goes towards the transfer of ownership of houses in Australia.
Why is the credit impulse important?
The data released by the RBA is the stock of all outstanding credit which takes into account existing debt, new debt and debt paid down. More important than the growth in credit is the growth in new credit that is issued. Starting with a basic premise that borrowing equals spending, its new credit issued in an economy that partly drives new spending in the economy. The other source of new spending in the economy is growth in income – not covered in this post. Consider a simple example – if you borrow $10 each month for six months, total credit grows by $10 each month, but after month one, growth in new credit equals $0 or, in other words, there is constant growth in credit and therefore you only spend $10 each month. But if you borrow $10, then $15, then $25, then $40 and finally $60, then there is growth in credit and growth in new credit of $5, $10, $15 and $20. As a result, spending grows each month. So the importance of tracking the credit impulse is that it is one of two important sources of spending that will impact output and/or asset prices.
I first came across the credit impulse through the work of Professor Steve Keen in his quest is to build a more robust and accurate representation of the role of debt and money creation by financial intermediaries in the economy. In working through the impact of growth in new credit on aggregate demand, Professor Keen’s latest work suggests the impact of the credit impulse is also influenced by the velocity of money. His latest thinking:-
“[This formula corrects] a rule of thumb proposition that I have previously asserted, that aggregate demand is the sum of income plus the change in debt (Keen 2014; see also Krugman 2013b). The correct proposition is that, in a world in which the banking sector endogenously creates new money by creating new loans, aggregate demand in a given period is the sum of aggregate demand at the beginning of that period, plus the change in debt over the period multiplied by the velocity of money.”
Source: http://www.debtdeflation.com/blogs/2014/02/02/modeling-financial-instability/#sthash.p9qge3RN.dpuf
I have not gone into the velocity of money detail for this post. Whilst I have quite simply represented the growth in new credit, it’s a useful view of credit nonetheless.
To what degree does the growth in new credit drive growth in output versus growth in net change in the value of assets? I think this is a fairly fundamental question that faces our economy and it comes down to the source of the growth in new credit.
Total Private Credit
The usual way to present the credit impulse is as a % of GDP so that we can relate the size of the growth in new credit to the size of the economy. But given that March quarter GDP will not be released for another month, I’m opting to present this data instead in its dollar amount in order to understand the general direction of the growth in new credit. All the credit components – housing, business and personal are all expressed in dollars in this post, which will serve as the basis for comparison.
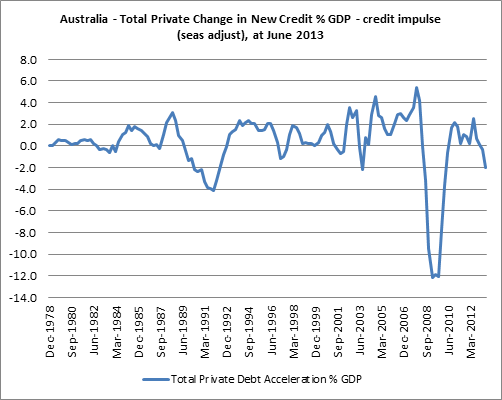
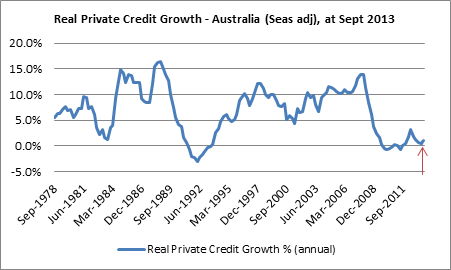
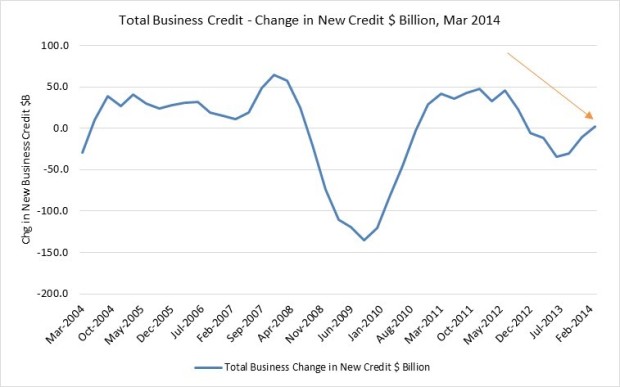
My proxy for the credit impulse – the growth in new credit – bottomed back in the June quarter 2013. Despite being in negative territory, the slope of the curve has been positive, meaning that the decline is getting smaller. Even a negative credit impulse with a positive sloping curve will have a positive impact.
The dollar growth in new credit for total private credit is approaching its two previous post-GFC highs, but is still well down on growth in the years leading up to the GFC:-
 Source: RBA, The Macroeconomic Project
This gives you a sense of the relative size of the current growth and its potential impact on the economy. But for the impulse to become a larger proportion of GDP, it needs to grow faster than GDP (we’ll know this when GDP data is released). The current size of the growth in new credit at Mar 2014 is $26.6b, up from $17.7b in Feb 2014.
The question now becomes which of the main areas of total private credit have been driving growth in new credit?
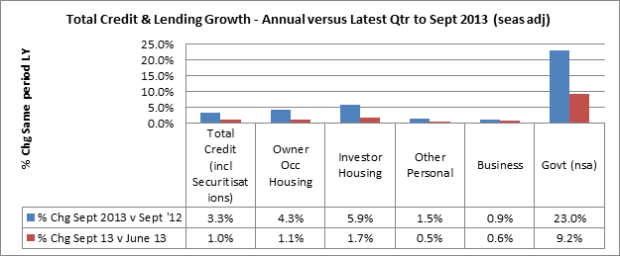
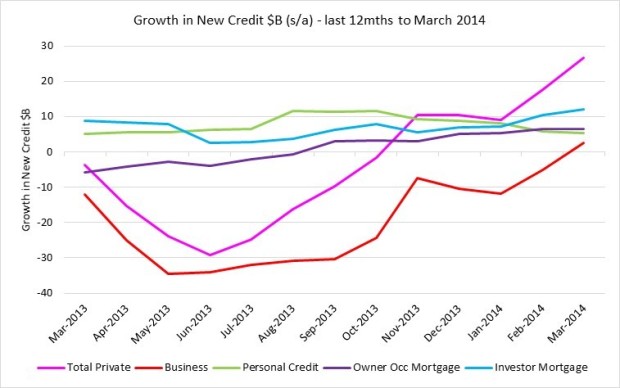
The four components that make up total private credit (each with their share of total outstanding credit) are – owner occupier housing (40%), investor housing (20%), other personal (6%) and business (33%). Below is the growth in new credit across these four (4) components and total private credit over the last twelve months:-
 Source: RBA, The Macroeconomic Project
There have been some large shifts in momentum over the last twelve months and a more positive shift in direction in the first quarter of 2014. The obvious one is the improvement in business credit – this has clearly had the greatest impact on the growth in new total private credit. But the actual dollar size of growth in new credit for business is still small relative to the other components (at Mar ’14). Growth in new investor mortgage credit is the largest of all components, which has also accelerated in the first quarter. Growth in new credit for owner occupier mortgage and personal credit are on par, but are, respectively, flat and decelerating.
Housing Credit – owner occupier and investor housing currently 60% of total private credit
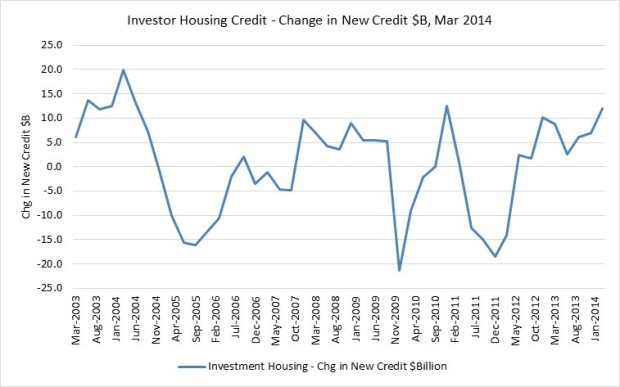
Investor housing credit currently makes up the largest proportion of the growth in new credit. In March 2014, growth in new credit was $12b, up from $10.3b in Feb 2014, despite only currently representing 20% of outstanding total private credit. So approximately half of the current growth in new credit in the economy is for investor housing finance.
The growth in new credit for investor housing is close to reaching its second highest point of the last ten years.
 Source: RBA, The Macroeconomic Project
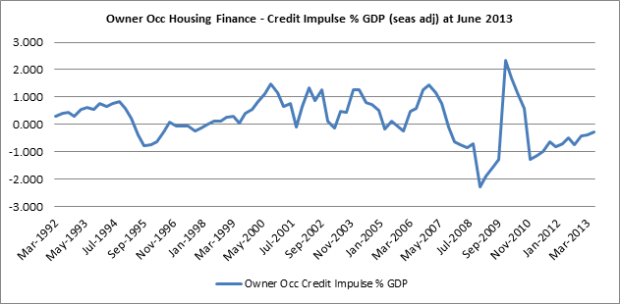
This is only one part of mortgage credit. More broadly, the growth in new mortgage credit was $18.5b in March 2014, up from $16.9b in Feb 2014. This includes the change in new owner occupier housing credit of $6.6b in mar 2014, which was unchanged from $6.6b growth in Feb 2014. This signals a slowing in growth momentum for owner-occupier activity.
The slope of the curves look quite different between owner occupiers and investors – steep for investors and less steep for owner occupiers. The steeper curve suggests faster/larger growth in new credit for investor housing and this is consistent with what we have seen in other housing finance data.
Growth in new credit for owner occupiers has been somewhat more subdued and at March 2014, is about half that of growth in new credit for investor housing finance. Although the slope of the curve started to steepen in late 2013, the latest data suggests that the momentum is starting to slow.
 Source: RBA, The Macroeconomic Project
The overall growth in total new mortgage credit remains strong and is obviously driven by investor activity.
So what can we expect as a result? Intuitively, you would expect accelerating housing credit growth to show up in asset values. As long as we have accelerating debt, it’s likely that we will continue to see house prices grow. Below is the mortgage credit impulse plotted with the annual growth in the residential property price index until Dec 2013. There is a reasonably strong correlation between the two (0.68).
 Source: ABS, RBA, The Macroeconomic Project
Some of the accelerating growth in housing credit will show up in GDP, but to a smaller degree, in Private Fixed Capital Formation. This part of GDP captures the value of the creation of new assets only – new dwellings and new alterations and/or additions will add to GDP in that quarter. This currently accounts for just under 5% of GDP at Dec ’13. According to the latest housing finance data, purchase and construction of new dwellings has accounted for only 12% of total housing finance over the last year (ex-refinancing). Many of the current First Home Owners grants have focused on the purchase of new dwellings as it’s the creation of new assets that is likely to stimulate the economy more because jobs and income are created through new projects, rather than through transferring ownership of existing dwellings.
The transfer of ownership costs (legal etc.) are recorded as a part of GDP under Private GFCF- ownership transfer costs, but includes all ownership transfer costs, not just those on dwellings. This accounts for approx. 1.4% of GDP at Dec ’13.
Overall, the majority of total private debt relates to housing – debt which continues to accumulate, for what is essentially an unproductive asset. The downside to this is that this debt for the most part does not contribute to growing the future earning capacity of the economy, employing people, innovating or generating productivity gains.
Business Credit – 33% of Total Private Credit
The growth in new credit for business was the bright spot in this report. For the first time since the RBA lowered interest rates in late 2011, the growth in new credit for business has reached positive territory. Business investment is the single area most likely to generate income growth, employment, innovation and productivity gains for an economy.
 Source: RBA, The Macroeconomic Project
The growth in new credit for business started to turn positive from mid-2013, but growth accelerated recently. In five months, growth in new credit for business has turned from a large negative to positive growth: Jan ’14 -$11.7B, Feb ’14 -$5.2B and Mar ’14 +$2.6b. Looking at the relative peaks over the last seven years (chart above), there is still a long way to go though.
Where is the growth in new credit for business likely to show up?
The labour market has been improving over the last several months – indicating at least progress on business expansion. There has been a shift from PT to more FT growth in jobs, although it appears that hours worked has not grown at the same rate. But this isn’t directly where growth in new credit is likely to show up.
This is more likely to show up in business investment. Over the last year, business investment has been slowing down and some forward indicators suggest that this will continue. One of the key objectives of the RBA in its easing stance has been to influence business investment and specifically to ‘rebalance’ investment towards non-resource sectors in light of the coming slow-down in mining investment. Recall that the first interest rate cut happened all the way back in Nov 2011.
Business investment and capex are measured in several ways. One way, is via the private new capital expenditure and expected expenditure survey (ABS 5625). This is not the equivalent of, or a complete view of the business investment component from GDP, but provides detail of expected capex expenditure, especially with regard to mining and manufacturing. You can read the full details of the inclusions and exclusions on the ABS website, but ‘all other selected industries’ excludes capital expenditure by all private businesses including units classified to agriculture, forestry and fishing, education, and health and community services industries and capital expenditure on dwellings by households.
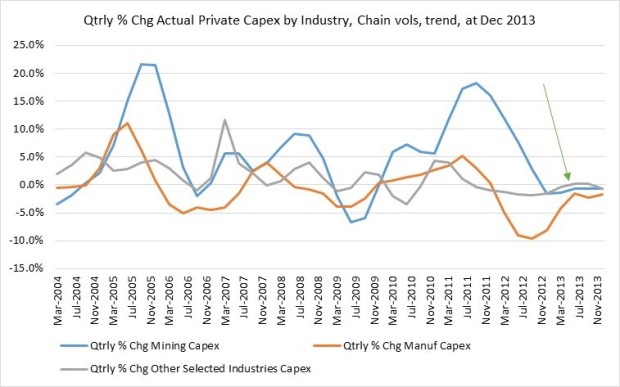
The slow-down in mining capex is evident in the actual private capital expenditure data (ABS 5625):
 Source: ABS 5625
I’ve opted for quarterly growth in this chart because I think it highlights the change in capex perfectly – “consistently slowing”:-
- Mining capex growth has slowed since Sept 2011 and started to record quarterly declines from Dec 2012. At Dec 13, growth was -0.6% versus Sept qtr. 2013, a far cry from the high growth recorded in the mid-2000 and during 2010/early 2011. But this not the “mining capex cliff”.
- Manufacturing capex growth peaked in Jun 2011 at 5.2% quarterly growth and since Mar 2012 has been in decline. Over the last year, the quarterly declines have become smaller, but capex spending continues to shrink – it’s not a drop off a cliff, but it’s a consistently lower value. At Dec 13, capex was -1.7% versus the prior quarter.
- “All other selected industries” capex has been declining quarter on quarter since Jun 2011. There were two brief quarters of small growth in Jun and Sept 2013, but Dec was back to decline of -0.6% versus the prior quarter. As mentioned though, this is a not a complete representation of all other industries. See note above.
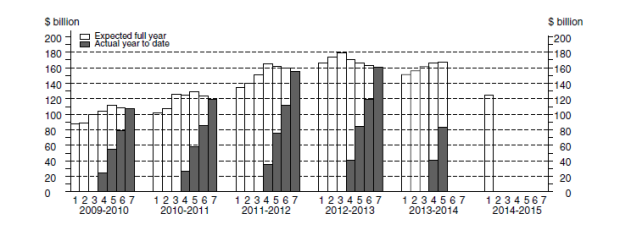
If you really want to know what the coming mining capex cliff will start to look like, then look no further. From the same ABS catalogue (5625):-
Source: ABS 5625
I’m referring to the 2013-2014 labelled graph above. The December ’13 quarter is marked ‘5’, which is half way through the 2013/14 financial year. Estimate 5 is made up of actual capital expenditure for the Sept and Dec ’13 quarters (as at the end of the Dec 13 quarter), plus the short term estimate for the Mar and Jun ’14 quarters. At this time, total capex for 2013/14 financial year is estimated to be $167,066m.
At the end of Dec ’13 quarter the first longer term estimate of capital expenditure is provided (E2) for the next financial year. This is the estimate marked ‘1’ for 2014- 2015 – and this is the estimate that has many spooked. Total capital expenditure is estimated at $124,880m, which is -17.4% lower than for the same period of 2013/14. The main reason for this lower estimate was a decrease in mining capex of -25.2%.
As mentioned, these estimates won’t add up to the investment data shown in the National Accounts – it’s a smaller view of what you would see in the GDP figures, but more detailed with regard to an ‘expectations’ view. The full explanation can be found on the ABS website.
So, looking at the more complete view of business investment from the latest GDP figures at Dec 2013 – this is what the quarterly growth in Private Gross Fixed Capital Formation (PGFC) for total private business investment looks like in the National accounts (ABS 5206.002):-
 Source: ABS 5206.002
This includes all private business investments in non-dwelling construction, new machinery & equipment, cultivated biological resources and intellectual property. This represents approx. 17.1% of GDP at Dec ’13. I have excluded private fixed capital formation for new dwellings, new alterations to dwellings and ownership transfer costs – as this relates to mortgage activity.
Growth in total private business investment has been slowing since June 2011 and turned negative in the Sept 2013 quarter and the quarterly decline accelerated in Dec ’13. Given this consistent decline, it’s difficult to see that, based on the small size of the growth in new credit for business, that there will be a large turnaround in business investment at this stage.
Other data sources, such as the 2014 quarter one NAB Business Conditions report highlights a pickup in capex intentions in the coming twelve months, but at the same time points to ‘patchy’ investment intentions across the non-resources sectors.
 Source: NAB
The latest NAB Business Conditions report for May 2014 (further out than the credit data I have presented here), suggests further gains in capex spending, but not enough to counter the falls in mining investment:-
 Source: NAB
Given the size of the growth in new credit for business, I wouldn’t expect to see large improvements in business investment, but would at least expect a slowing of the decline for the March 2014 quarter GDP. There doesn’t yet appear to be high enough non-resources investment growth to counter the end of the mining investment phase.
Personal Credit – 6% of Total Private Credit
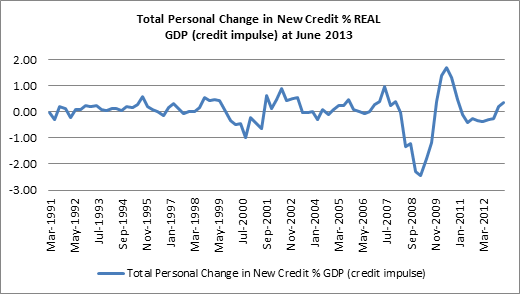
Over the first quarter of 2014, growth in new credit for total personal credit has been decelerating. Growth in new credit for personal lending reached a high of $11.6b in Oct 2013 and that growth has virtually halved since then to $5.4b at Mar 2014.
 Source: RBA, The Macroeconomic Project
Total personal credit represents activity conducted with a bank on a non-business basis (excluding housing). This includes all manner of personal spending, so there isn’t one good place where you would expect this growth in new credit to impact output. It would likely be a combination of retail sales, new car sales and/or other discretionary spending etc.
Either way, growth in new credit for personal may be pointing to a slow-down in growth of the more discretionary spending categories (this is most likely where you’d find personal credit used).
Has this started showing up in Q1 retail sales? The month on month growth in retail sales has been slowing (sales remain high though), and whilst it does look like there is a correlation between the two measures, the correlation isn’t strong at all (0.23).
There was a stronger relationship between the actual personal credit impulse (as a % GDP) and the annual change in the Household Final Consumption Expenditure (HFCE) component of GDP (0.46) – at Dec ’13. The HFCE component of GDP is the single biggest part of GDP approx. 50%, so clearly spending that shows up here is ‘funded’ by a combination income as well as change in new credit.
 Source: ABS, RBA, The Macroeconomic Project
It’s still not an ideal relationship/proxy, but does at least provide a very general view.
One thing to bear in mind is that a slowing in new personal credit growth could also reflect the current improved labour market conditions. It’s possible that income growth via increased labour market activity may counter any slowing in the growth of new personal credit. Using trend numbers for the first four months of this year we’ve seen +50k FT jobs (the first 4mths of 2013 was -11k FT jobs) and +22k PT jobs (the first 4mths of 2013 was +61k PT jobs) added. Unemployment has ‘only’ grown by 6.8K in the first 4mths of this year (versus 26.7k for the same time last year). This may have an impact on consumer discretionary spending, possibly cancelling out any slow-down in growth of new credit in personal spending for now.
Overall, the majority of the growth in new credit is going into housing – via investor activity. But it’s worth noting that growth in new credit for owner occupier housing appears to be slowing. For the moment, this is still likely to result in continued house price appreciation. Whilst business investment and expected capex, so far, looks like it will fall short of countering the drop in mining investment, the growth in new credit for business is an encouraging sign. But this needs to continue to accelerate in order to fuel business investment in new, productive activity in the economy. Business will likely expand investment if there is a strong growth business case. The continued high level of the Australian dollar, any potential impact of a slow-down in China and changes to fiscal policy are going to weigh on these business investment decisions.