Over recent years employment growth in Australia has fallen below historical levels. The reporting of a single growth figure each month fails to highlight this, and other important benchmarks such as whether employment growth is high enough, or if employment growth is broad based across states and/or industries. This level of detail, and the direction of those moves, tell an important story of the state of the labour market and how it fits with the current growth narrative of the economy. The purpose of this post is to unwrap the employment growth numbers to understand the broader context of employment growth in Australia and then to get into some detail regarding the states and industries within states, that are over or under-performing with regards to employment growth across Australia.
The most striking thing about this analysis is that the top four industries that over-performed in relation to employment growth (and contribution to overall growth) are not directly related to the Mining-Construction-Housing growth narrative of Australia. In the last year, Health Care, Education, Retail and Agriculture were the industries where employment growth exceed the National average and made a significant contribution to overall employment growth. Employment in industries such as Mining and Construction declined, or grew at well below the National rate of employment growth. This highlights that we are in the midst of a change to the industry employment landscape in this country. While that landscape is constantly evolving, the implication of this shift to greater services-based employment becomes obvious when you compare the differences in average weekly earnings across industries. The general lack of growth in Full Time (FT) employment is also a major theme across many states and this has been well hidden in many cases (unless you live in one of those states).
The broader context of employment growth in Australia
There are two very important points about employment growth in Australia.
Firstly, on several measures, employment growth has been too low over the last three (3) years.
As of August 2014, annual growth of total employed persons was 167.7k persons. This sounds like a big number, but it’s below the ten year average of growth in August of just over 200k persons. Employment growth has been well below this longer term average since late 2011:-

Source: ABS
Employment growth has started to improve, with the trend moving toward that 10yr average. The composition of this growth is important too – more on this shortly.
This longer-term average rate of employment growth is actually fairly representative of the level of employment growth required to keep up with population growth.
By this measure, employment growth has also been too low. Since the start of 2011, population growth has added workers to the labour force at a faster rate than employment growth. The chart below compares the difference between the growth in total employed persons and the growth in the labour force as a result of population growth (this is estimated). When that number is negative (below the orange zero line), it suggests that employment growth is below what population is adding to the labour force.

Source: ABS
The implication of this lower level of employment growth has been a growing number of unemployed persons and a declining participation rate. Population is adding approx. 215k persons to the labour force annually, so employment needs to grow by roughly the same amount to maintain the status quo. Only in the last 4 months (chart above), has employment growth started to accelerate beyond what population is estimated to add to the labour force.
This brings me to the second important point about employment growth in Australia.
It’s obvious from the charts above that employment growth has improved during 2014. What is driving this improvement is growth in Part-Time (PT) employed persons. This is not a recent trend and the proportion of all workers that are PT employed has reached a new high in the Australian labour force. As of August 2014, 30.5% of all people employed are PT employed.
So while the 2014 overall employment number looks like its improving, you can see from the chart below that the composition of that growth has changed during 2014 – FT employment growth has slowed consistently since March and PT employment has grown in its place.

Source: ABS
The slowing of FT employment growth is not a sign of improving demand conditions. In the bigger picture though, growth in PT employed persons is still preferable to a decline in employment.
There is a clear implication for incomes as a result of this growing proportion of PT employed persons. To provide some broad context of what this means for incomes consider the difference in average weekly cash earnings for FT and PT employed persons:-
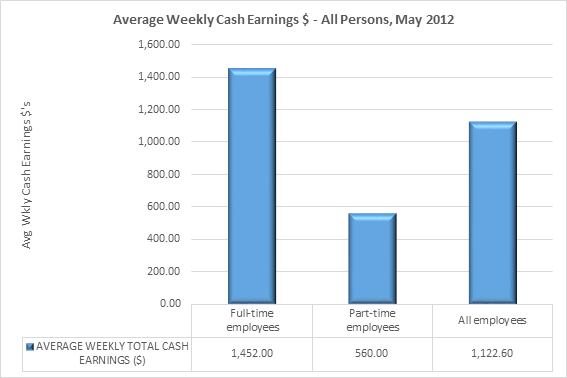
Source: ABS
These are gross amounts and will of course differ by industry, gender and state. A median measure would likely be more accurate as well. But the idea is to provide a broad sense of the relationship between FT and PT earnings – average weekly cash earnings for PT employees are roughly 40% of that of a FT employee.
According to Household Income and Income Distribution data from the ABS (ABS 6523.0 2011-12), wages and salaries account for over 60% of total household income with only 9% coming from Other Income and 25% from Government Pensions & Allowances. To some degree, wages and salaries are being supported by other sources of income.
As long as this trend toward higher PT employment continues, there is likely to be a negative impact on income which is likely to impact spending and government tax revenues.
Detailed state & industry employment growth
It’s useful to look at employment growth from a state and an industry perspective in order to understand how employment growth in states and industries within states are performing relative to the National picture. This is especially important where states tend to have some regional advantage, for example, Mining in WA.
An industry within a state is deemed to have over-performed where the employment growth rate in that industry is greater than both the overall National employment growth rate and the National employment growth rate for that industry. An industry or a state is deemed to have under-performed where that industry or state has grown at a rate slower than that of the overall National rate.
This means that employment growth hasn’t necessarily declined, but it highlights those industries or states where employment growth is slower or lagging the National average – a far more subtle indicator of performance.
The selection of time periods is crucial to the success of this analysis in providing a clear and accurate view of state and industry based employment growth trends. I’ve selected the last three (3) years (between the qtr. to Aug 2014 qtr. and the qtr. to Aug 2011) and supplemented with annual data, as this coincides as closely as possible with when employment growth in Australia started to dip below its long-term average. It’s also very close to the same period where the RBA started to lower interest rates, so it’s an interesting period to see what impact that has potentially had on employment growth. It’s been an important period of transition for the economy with the Mining boom starting to shift gears from the labour-intensive investment phase to the cost-cutting production and export phase. The RBA has been attempting to ‘rebalance’ growth in the economy, namely investment, to boost non-resources capex activity via lower interest rates. Capex data suggests that Dwelling Construction is responding to a degree.
Looking at the industries that have over-performed (versus National employment growth) from the last 3 years to the last year, highlights a shift in employment growth performance in some key industries:-
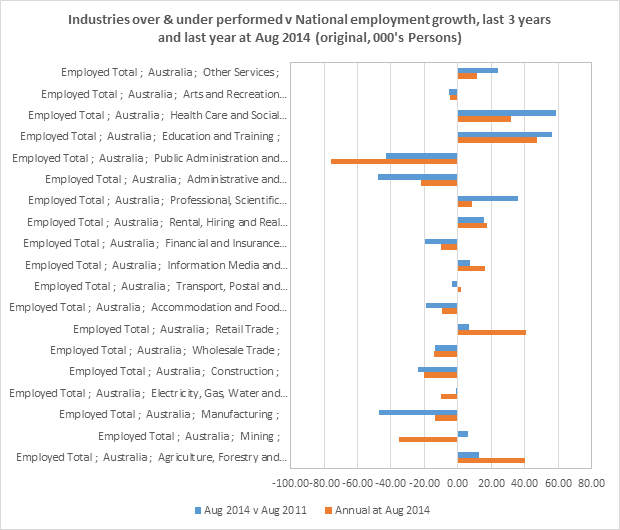
Source: ABS
Major highlights and how this fits with the current growth narrative:-
Mining employment growth – has gone from performing slightly better than at the National level, to well and truly underperforming in the latest year. Total employed in Mining has declined year on year by -29k persons or -11%. This should be no surprise given the increasing shift to the production phase of the mining boom (which is in theory less labour-intensive). The key markets leading this performance with declines in persons employed in Mining are NSW (-15k), QLD (-6k) and WA (-11k). What is interesting is that the WA state level employment growth still continues to outperform all other states despite the declines in Mining employment. More on WA later in the post.
An industry partly related to Mining is grouped under Professional, Scientific and Technical Services. Employment growth in this industry still over-performed versus the National average in the latest year with growth of +3%, but it does represent a large slowdown in growth versus three years ago, which was +8%. Employment growth in this industry has been driven by states such as QLD, SA, WA and NT, ranging between +7% and +66% employment growth over the last year. This is potentially linked to further exploration and development of resources projects in those states. Only in Vic did employment in this industry decline quite severely by 10% over the last year.
Construction – the underperformance of Construction employment growth doesn’t seem to fit with the emerging narrative of Construction leading the ‘rebalancing’ from Mining. Growth in total employed persons in Construction was only 0.3% over the last year and 2% versus three years ago. The Construction industry is the single largest FT employer at a National level. Yet, FT employment declined over the last year by -21k persons – most of which was a large decline in the latest quarter. All of the growth in Construction employment over the last year has been in PT employment (+24k persons). From a state perspective, Construction employment grew at above the National rate only in NSW and TAS. Construction employment in NSW grew by +29k persons or 10% over the last year, 16k of which were FT. In other states, Construction employment actually declined over the last year.
The trend over the last three years is also interesting. In this case, it looks like total employment for both FT and PT employed persons in Construction had increased consistently since August 2012. It’s been in the last two quarters where total FT employed in Construction has started to fall, while PT has continued to increase. So PT employment in Construction seems to replacing FT employment. There is also some possible noise in the data given that it is original (I have not adjusted the data) and the change was mostly in the latest quarter.

Source: ABS
This does throw some cold water on the idea that a rebalancing led by Construction may be underway – only in NSW and TAS is employed persons in Construction growing and overall, only PT employed in Construction has been growing in the last year. The latest Performance of Construction Index, on the other hand, has grown for the fourth consecutive month in September, led mostly by house and apartment building, while engineering construction continued to contract. The overall index shows quite robust expansion, so increased activity could still show up in employment growth in the Construction industry.
There is possibly a correlation between the growth in Construction employment and the boom in housing (investment) that is currently underway in NSW. Although, there is similar high growth in housing lending and house prices in VIC, but Construction employment declined by -7% over the last year.
Other industries related to Construction and this housing boom include Rental, Hiring and Real Estate Services and Financial & Insurance Services. Employment growth in Rental, Hiring and Real Estate (RHRE) has over performed versus National employment growth – but there are only two states that are driving this performance – SA and WA. In NSW and Vic, employment in RHRE grew by +4% and +10% respectively – while this is still high, that growth under-performed the market. Employment growth in Financial and Insurance continued to under-perform the overall National growth rate – and employment in this industry actually declined by -0.2% in the last year. Only in Vic and TAS did employment in Financial Services actually grow.
Manufacturing – The underperformance of manufacturing employment growth has improved in the latest annual data, driven by stronger growth in PT employed persons (+19k) whereas FT employed persons declined by -13k persons over the last year. The shift from FT to PT employment in Manufacturing should be no surprise given the long term decline in employment and share of output in the sector.
And the biggest overall employers in Australia….
The top three (3) industries by size of employment are Health Care & Social Assistance (1.4m persons), Retail (1.2m) and Construction (1m).
Employment in Health Care & Social Assistance has grown at double the National rate of employment growth over the last year and three years. Most of the growth has been in FT employed persons. Employment in all states except NSW and VIC has grown at above the National rate of employment growth. In NSW and Vic, employment in Health Care & Social Assistance declined over the last year.
Employment growth in Retail has also over-performed on an annual and three year basis. The only difference is that 60% of the jobs growth is PT in nature. Most states over-performed in relation to Retail employment growth with the exception of QLD, NT and TAS.
The industry where employment grew at the highest rate of all was in Agriculture, Forestry & Fishing industry, with +16.5% employment growth. This is a really bright spot for the economy and it’s not yet clear how this fits into the economic growth narrative of the country, albeit that Australia could have a significant role to play as a global leader in the provision of (safe) food sources. This industry significantly over performed both in FT and PT employment and the only states where Agriculture, Forestry & Fishing grew at below the 16.5% rate were QLD and WA.
State-level employment growth
Only in WA and NT has employment grown at a rate above the National growth rate of 4.4% in the last three (3) years, with NT representing a small proportion of the total workforce.
That situation has improved somewhat in the latest year with more states now growing at above the National rate of employment growth (orange bars, below):-

Source: ABS
On an annual basis:
- WA and NT continue to outperform all other markets in terms of employment growth
- Employment growth in SA and TAS has accelerated over last year compared to 3 years ago
- Employment growth in the bigger states of NSW and VIC has slowed further and remains well below National annual employment growth rate of 2.2%, which is a concern
New South Wales
On the 3 year basis, employment growth in NSW hasn’t been too bad, but there should have been stronger FT employment growth.
Employment growth over the last 3 years was +140k persons, but if NSW grew at the National rate, employment would have grown by 153k persons. What accounted for this? Growth in FT employed persons underperformed the National rate of employment growth – if FT employment in NSW grew at the National rate, FT employment growth would have been +22k higher. That’s clear from the trend in actual employed persons below – both FT & PT employed totals continue to increase, but FT employed failed to reach a new (what looks seasonal) peak in Feb 2014.
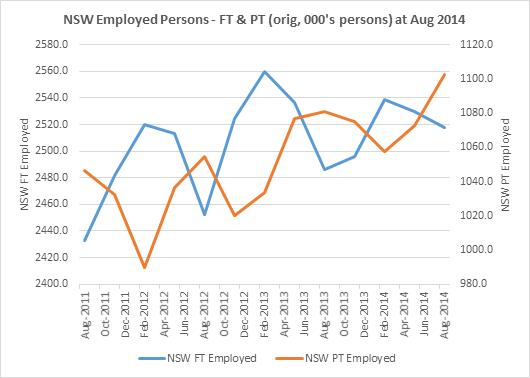
Source: ABS
The concern is the continued slow-down/under-performance in employment growth in the latest annual data. This was driven by lower growth in both FT and PT employed persons (to a lesser degree).
The major contributors to FT employment growth were industries such as Transport, Wholesale and Warehousing (+24k FT jobs), Construction (+16k FT jobs) and Info Media and Telecoms (+13k jobs). The issue is that in only seven out of nineteen industries did employment grow faster than the National rate of employment growth for that industry – meaning that under-performance of FT job growth is prevalent across a range of industries in NSW.
PT employment has grown faster than FT, but still under-performed the National average. Growth in PT employed persons was led by Construction, Retail Trade and Education and Training.
The results are interesting given that NSW is ground zero for the investment property boom at the moment. There seems to be disconnect between the booming housing market there and the overall below average employment growth.
Victoria
The main issue in Victoria is the lack of FT employment growth. Total employment growth in Vic over last 3 years was +101k persons made up of growth of only +7k FT employed persons and +94k PT employed persons. If Vic FT jobs had grown at the same rate as the National employment rate, FT job growth would have been 85k (versus the 7k actual). The situation is similar on an annual basis.
Where did all the FT jobs go in Vic? In the latest year, there was a decline of -21k employed persons in Construction and a decline of -25k persons in Professional, Scientific and Technical Services.
Manufacturing is the single largest FT employer in Vic (243k persons) and FT jobs growth wasn’t actually that bad at +0.2%, just under the National rate of growth in Manufacturing employment of +0.7%. Overall Manufacturing employment in Vic has remained fairly stable.
The other issue is that there were a large number of industries where growth in FT jobs under-performed in Vic relative to the National average for each of those industries. This under-performance was broad based and points to relatively lower employment growth across a range of industries. For example, employment in Health Care and Social Assistance (which is the largest overall employer in VIC) is growing annually at 5% Nationally, yet in Vic, employment declined by -0.5%.
Queensland
Growth of employment in Queensland has improved to just above the National level in the latest year. But the weakness underneath that number is that FT job growth underperformed. In Qld, FT employed persons grew at only +0.7% versus the National annual growth rate of 2.2%. If FT employed persons in QLD had grown at the National rate, FT job growth would have been +71k FT employed persons versus the +12k actual. That’s a fairly significant difference.
There were three major contributors to that underperformance in FT jobs growth. Full-time employment declined in: Agriculture Forestry and Fishing by -23k persons, Manufacturing by -23k persons and Public Admin by -14k persons. The growth of PT employment in these industries didn’t come close to off-setting the declines. The largest FT employer in QLD is Construction and FT employment growth of +0.3% under-performed compared to the +7% growth in PT roles. There is nothing in the trend of this data to suggest that this might be the start of any Construction-led rebalancing in this state.
Instead, most of the employment growth in QLD has been in PT roles which grew at 13% over the last year and this has been enough to drive the overall employment growth rate in QLD to above the National level. This growth was driven by the biggest PT employers: Health Care and Social Assistance +19k, Retail +18k, Education & Training +8k and Other +9k.
South Australia
Over the 3 year time frame, employment growth in SA has been weak on a number of measures. Total employment growth in SA of 1% under-performed the National rate of growth of +4.4%. All of the growth was in PT employed persons. The total number of FT employed persons actually declined over the 3 year time frame by 3k persons. This was driven by employment declines across a broad range of industries.
But recall that employment growth in SA had picked up on an annual basis. The results are very encouraging in that most of the growth has been in FT employed persons. FT employed persons in SA grew at a much faster rate +3.1% than the National rate of 2.2%. PT jobs grew on par with the National rate of growth. This is quite a good turnaround for the state.
The improvement in SA performance was the that declines in FT employment over the 3 year period (Financial Services and Insurance , Manufacturing, Retail and Wholesale), halted over the latest year.
The composition of the growth points to a shift in SA industry. Manufacturing in SA accounts for the largest share of FT employed persons, but FT employment declined on an annual basis by -3k workers (it’s still the biggest FT employer). Instead, FT employment growth came from Professional, Scientific and Technical Services +13k persons, Agriculture, Forestry and Fishing +10k (also strong PT job growth here) persons and in Education and Training +6k persons. The longer term trend suggests that employment growth has flattened out, but it’s a good result nonetheless.
Western Australia
This has been the one state that has over performed the National employment growth rate on both a three year and annual basis.
But a fundamental shift has occurred over the last three years – growth in FT employed persons has been leveled off and PT employment growth has accelerated over 2014. In fact, growth in FT jobs has slowed from 9.9% (last 3 years) to only 1.5% annual, which under-performed the National annual rate of 2.2% growth. Over the last year, this lower growth in FT employed persons was offset by a 10.6% growth in PT jobs, making the WA market still look reasonably strong.
This is a big turnaround from the three year growth and the shift in trend is easy to see in the chart below…

Source: ABS
From an annual perspective, FT employment declined in: Mining by -12k persons (and it declined faster than the National rate of decline for Mining jobs), Electricity and Gas by -7k persons (also declined faster than the Nat rate of decline), Construction by -1.6k persons (still the single largest FT employer in WA), Public Admin & Safety by -10k persons. These industries are all closely related to Mining.
FT employment in WA grew at a rate below the National rate for that industry in ten (10) out nineteen (19) industries. There were still several industries that had strong FT growth (over-performed) – Professional, Scientific & Technical Services +18k persons, Retail Trade +13k persons and Real Estate Service +10k persons were the three largest.
The over-performance in PT jobs growth comes from: Retail +10k jobs, Accomm & Food Service +8k and Health Care & Social Assistance +9.7k jobs. In fact 11 out of 19 industries grew PT jobs at a rate faster than the National rate for that industry.
We are starting to see employment in Mining and its related industries impacted by this shift to the production phase of the boom. So far, industries that receive some flow-on benefit from the boom (Retail, Food Service) are yet to see much impact on employment growth.
When you layer this with the value of average weekly earnings (Mining indexes at +170% above the average), the significance of this shift becomes obvious. Which makes me wonder how long employment in some of these other industries will continue to grow.
Tasmania
Tasmania has also been one of the big turnaround stories over the last year with employment growth of +4.1% outpacing the National rate of employment growth of +2.2%. This has been driven by an over-performance of PT jobs growth. PT jobs grew by 6.5% and FT jobs grew mostly on par with the National rate of growth, which is still a good result.
The historical heartland of FT employment in TAS has been in Manufacturing (ten years ago was the largest FT employer). Over the last year, FT employment in Manufacturing grew by 19%, seriously bucking the National rate of growth in Manufacturing jobs of +0.7%. There was also strong FT job growth in Agriculture, Forestry & Fishing of +23%.
The higher growth in PT jobs were concentrated in Accomm & Food Service +3k (which more than off-set the -1.4k FT jobs in this industry) and Education & Training +2.3k (which also off-set the -1k FT jobs in this industry). To a much smaller degree, there was growth in Professional, Scientific & Technical of +1k persons and Health Care & Social Assistance of 1.3k persons.
Northern Territory
This has also been a state that has over-performed the National rate of employment growth. In the last year, this has been driven mostly by growth of FT jobs. Although this growth was quite broad-based (12 out of 19 industries grew faster than the National rate for each industry), most of the growth came from one industry – Prof Scientific and Tech +3.3k (total FT employ growth was 4.3k for the year). To a degree, this is going to be Mining related (through exploration etc.). Employment within the two biggest FT employers – Public Admin & Safety and Construction both declined in the latest year.
Australian Capital Territory
It should be no great surprise that employment growth in ACT has deteriorated in the latest year versus the 3 year period given the direction of the Abbott government to reduce the number of public sector jobs.
Over both time frames, employment growth in ACT has under-performed the market. In the latest year, growth has slowed considerably. Growth in FT jobs remains above the National rate +2.7%, but PT jobs in ACT actually declined year on year by -5.7%. The three major contributors to that decline were Public Admin & Safety of -5k persons, Education & Training of -2k persons and Health Care & Social Assistance of -1k persons.
A final point on Average Weekly Earnings (AWE’s)
A great overlay to the discussion on employment growth by industry is AWE’s by industry.
The potential impact on wages and salaries of the decline in Mining employment, and related industries, becomes obvious when you view the AWE for FT adults. Mining AWE’s, for example, index at 170% of the AWE’s for all industries. Contrast this with the AWE’s in Retail, which had the highest overall contribution to the growth in total employed persons over the last year (+67k persons). The AWE’s for FT Retail adult indexes at only 70% of the AWE’s for all industries.
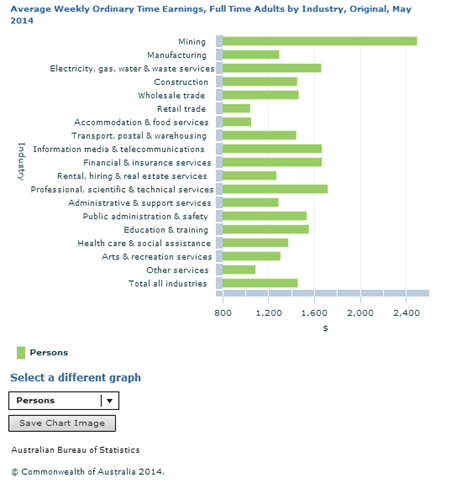
Retail has always been a big employer, but has operated, most recently, with the backdrop of high wages from Mining and a credit/consumption boom, pre-GFC. It’s not likely that these days will return, so it seems like some of this employment growth is based on shaky ground.
 Source: ABS
 Source: ABS
 Source: ABS
 Source: ABS
 Source: ABS, The Macroeconomic Project
 Source: ABS
 Source: ABS