Housing Finance

Cracks in the foundations of housing finance

The latest raft of housing finance data was released for the month of October last week. On aggregate, growth in housing finance is still strong, which means likely continued growth in house prices in Australia over the next 6-9 months. While the total value of dwellings finance again reached a new all-time high of $23.8b in October, that growth is not broad-based. Growth in housing finance continues to be driven by investor activity, mainly in NSW and VIC, while at the same time, owner occupier activity continues to slow – a trend that is now well in place. An increasing number of questions are being asked about the sustainability of and the risks posed by this level of growth, especially in investor activity. Over the last few weeks, there have been important messages of a shift in the risk profile of our regulators which would impact the growth of housing finance, especially for investment purposes. These include the Murray Inquiry recommendations, APRA increasing its surveillance of mortgage lending practices and the recent announcement that ASIC will investigate the growth in interest only mortgages.

Over the last 12 months, house prices in Australia have grown by over 9% – just below the high rates achieved during the First Home Owner Grant fuelled growth after the GFC. This news is usually trumpeted by all those representing a more bullish view of the role of housing in the economy. How can rising house prices be anything but good for the economy? But consider that the continued growth in house prices relies on the continued growth in housing finance and debt. This recent increase in house prices has been the result of accelerating growth in leverage – real mortgage debt as a % of GDP in Australia is now just 0.9% pts shy of its all-time high of 84.6% reached in December 2010. Debt per-se is not a bad thing – it helps to support investment and productive activity in the economy. While the growth of housing debt is not new in Australia, there is an increasing risk associated with this debt emerging in the broader environment.

All data quoted excludes refinancing of established dwellings.

Another record month for housing finance in October

This latest month of data shows that the value of total housing finance reached an all-time of $23.8b in October 2014. This was +0.4% higher than the previous month and is now 13% higher than the value reached at the previous all-time high in June 2007. On an annual basis, all dwellings finance is growing at +18%.

Source: ABS

The total value of the flow of new housing finance is an important driver of house price growth. We can also measure this another way by the growth in new credit based on the “change of the change” of the stock of outstanding credit. This shows that growth in new credit for mortgages continues to accelerate at a total level.

Source: RBA, The Macroeconomic Project

This trend in housing finance and house price growth has broadly been in place since the start of the latest round of interest rate cuts commenced in late 2011. Since then, expansionary monetary policy has been aided by accommodative global financial conditions i.e. QE. This has resulted in lower funding costs for the banks on global markets which have filtered through to the lending market. This has helped to generate greater price competition in the mortgage market with some banks offering fixed rate mortgages at below 5%. The current benchmark standard variable rate is 5.95% (RBA F05 Benchmark lending rates, Nov 2014). But interest rates haven’t been the only thing to drive this growth – taxation policy, the introduction of leverage into SMSF’s and foreign ownership rules have all contributed to the ongoing growth of housing finance, debt and house prices by finding the next marginal buyer of property.

Owner occupier lending is slowing down

Underlying these totals, the story is a little different. One important point from this latest data is that growth of housing finance for owner occupiers is no longer growing as fast – slowing over the last eight (8) months from +15% to now just over 10% growth on an annual basis – which is still high, but well below that of the total market.

Source: ABS

The biggest segment of owner occupier housing finance is for the purchase of established dwellings. This group has historically been the largest segment of lending overall and also a broader indicator of the state of household confidence and spending. The contribution to annual growth from owner occupiers buying established dwellings has shrunk considerably in the latest quarter versus the annual result. The contribution from owner occupiers borrowing for the purchase of new dwellings remains limited. The impetus for growth in housing finance is clearly coming from investors.

Source: ABS

Despite the growth in lending at a total level, owner occupier activity hasn’t grown to the same degree. The value of owner occupier housing finance is still well below the peak achieved during the super charged First Home Owners Grant (FHOG) during the GFC and the current monthly total is -7.5% below the all-time high achieved in Sept 2009.

Importantly though, the growth in owner occupier activity experienced from late 2011 until the end of 2013 has slowed down.

Source: ABS

The currently monthly value of owner occupier finance is only -1.9% below the recent peak in Nov 2013, so there has been no decline of any significant nature.

The slow-down is also reflected in the number of owner occupiers taking our housing finance commitments – this is probably the most accurate characterisation of the situation – the number remains at a high level, but without growth.

Source: ABS

Annually, the number of owner occupier commitments has grown by +6%, but that has now slowed to just 1% growth in the latest quarter to Oct (versus the same qtr. year ago). So virtually no growth in the number of commitments at a National level – but no decline either.

Digging deeper into the state data reveals that:

  • While NSW accounts for the largest % point contribution to annual growth in owner occupier housing finance, that contribution has dropped considerably in the latest quarter – this might be no surprise given the level of investor activity subsequently pricing owner occupiers out of the market
  • Owner occupier finance in WA has made a slightly negative contribution to growth in the latest quarter
  • QLD and VIC are making up the larger contribution to growth in the latest quarter

Source: ABS

In NSW, the slow-down in growth has been driven by owner occupiers buying established dwellings (ex refi’s) and new dwellings. Neither shows a convincing decline in the trend though, so it’s difficult to read too much into this except that growth has slowed.

In WA, the slow-down in the latest quarter is also driven by owner occupiers buying established dwellings – again, the trend is not clearly down either.

Investor activity continues to grow

Investor housing finance has been the main driver of growth in the market – growing at over 28% year on year. All segments of investor activity now accounts for nearly 70% of the growth in housing finance ex refinancing. The annual rate of growth has been sitting around 28% since April 2014.

Source: ABS

While the rate of growth has remained at the 28% level, the monthly value of housing investment finance activity continues to reach new highs – over $12b in the latest month. This is driving the broader growth in housing finance.

Source: ABS

There have been some signs of slowing growth in recent months, but the market just continues onto new highs.

Even at a state level, growth is strong. Looking at the latest quarter versus annual growth in investment housing finance, it’s clear that some of the growth rates have come off the boil, but they are still very high overall. The states that are making the largest contribution to overall growth in the value of investment housing finance are NSW, VIC, QLD and to a smaller degree, WA.

Source: ABS

The level of investment housing finance in states such as NSW, VIC, QLD and TAS are at their near term highs (in the period since interest rates were cut in Nov 2011). In QLD, WA & TAS growth in investment housing finance has accelerated in the latest quarter versus the last year.

This increase in investor activity has created a shift in the market. Housing investors now account for a much larger share of housing finance – this is the first time in the data series that investment housing finance has exceeded the value of owner occupier commitments.

Source: ABS

An increasing proportion of investors in the market creates some risk. Financing for investment properties is based on the use of interest only mortgages in order to take advantage of the tax benefits of negative gearing. This means that investors pay only the interest component for a fixed period. At the end of that period, loans either revert to principle + interest loans (P&I), are refinanced to extend the interest only period (assuming it can be) or the loan is paid off (by selling the property).

Most property investors in Australia make a net rental income loss – the total net income losses in 2012/13 financial year was -$8b (Source: ATO). In other words, the annual rental income of investment properties does not cover the interest payment plus other expenses. Whilst negative gearing is used as a tax minimisation strategy, housing investors are making one big bet on increasing house prices. Given the high rate of growth in investor housing, the sentiment seems to be one of “prices always go up”. Housing investors have moved to this level of ‘Ponzi’ financing, relying solely on capital gain for payback.

This situation has been in place for a long time now with a growing number of investors making losses in order to reduce their taxable income. This increasing loss has been the result of higher property prices together with much slower growth in rental prices/income. The reductions in interest rates has helped to cushion some of this, but even at these low rates, interest expense is still approx. half of the expense incurred by a property investor.

Source: Egan & Soos, Bubble Economics – Australian Land Speculation 1830 – 2013

According to latest ATO stats, an estimated 1.9m taxpayers claimed the total -$8b loss in 2012/13, up from an estimated 1.6m investors in 2008/09.

Given the growth in investment housing finance, interest only loans are growing as a proportion of total lending – reaching over 42% of new housing loans approved in Sept qtr. 2014 (by total value all ADI’s).

Source: APRA

Slightly more concerning is that there also appears to be a growing number of owner occupiers using interest only loans. This next chart shows the difference in %pts between the share of investors and the share of interest only loans. That gap is widening. In the Sept 2014 quarter, investors represented 37.5% of all new housing loan approvals and yet interest only loans represented 42.5% of all new housing loan approvals – a gap of -5.1% pts. A difference of zero would imply that investors are taking out interest only loans – but the current situation shows that, at the very least, investors plus non-investors i.e. owner occupiers, are also taking out interest only loans.

Source: APRA, The Macroeconomic Project

This is riskier for an owner occupier given they cannot claim the interest expense as a part of a loss to reduce taxable income. If an owner occupier can’t afford the repayments of a standard P&I loan now, then they are betting 1) their income will be larger at the end of the interest only period (to manage a higher monthly repayment if it reverts back to P&I) or, more likely, 2) house prices will continue to appreciate such that at the end of the interest only period, the owner occupier will be able to pay off the loan by selling the property. Under the condition that house prices rise, the owner occupier could refinance (the capital appreciation providing the ‘equity’) – but it will likely be a more expensive loan in the longer run.

Emerging risks in the system

Concerns have been growing about the level of growth in housing lending that is fuelling higher house prices, especially in investor related activity. There are several emerging risks in the broader economic environment:-

Signalling that the US will raise interest rates in 2015. Importantly, the current growth in Australian housing has been off the back of historically low rates, lower funding costs for the banks and generally high levels of global liquidity. An increase in US rates would be the first moves in tightening of global liquidity (until such time that the ECB actually does implement some form of QE). This would likely increase bank funding costs in Australia with those costs most likely passed onto the consumer/borrower. Tighter liquidity conditions are likely to slow the level of house price appreciation in Australia. The likelihood of rates rising can be debated at length, but at the very least, the liquidity provided by QE is no longer growing.

Slowing growth in Australia. This brings into question whether rates will really rise in Australia in the short term. According to the RBA current interest rate settings are right for the current environment. But a slowing economy is likely to impact growth in housing finance regardless. We are possibly seeing some of that effect reflected in the slowing of owner occupier activity as ‘affordability’ starts to limit the level of debt growth in combination with slowing income and wages growth.

These broader economic risks, together with the current level of activity in our housing market, seem to be feeding into a heightened level of regulatory attention. Whether this leads to action on the part of our regulators is another story. Several areas are in focus:-

An increase in lending concentration risk. This was highlighted by the recent Murray Inquiry as well as in the recent round of APRA banks stress tests. Australian banks have continued to build greater concentration in and exposure to the housing market in their loan portfolios, with mortgages increasing from 55% to 65% of lending over the last 10 years (Source: APRA). Mortgages are seen as lower risk, hence attract a lower risk weight in the calculation of capital requirements. The increase in concentration of mortgages over the last ten years has had the effect of actually reducing the amount of capital banks are required to hold – and actually, the improvement in capital ratios is a result of the increasing shift into mortgages rather than any deleveraging. But in effect, the combination of greater concentration in housing loans and the reduced requirement for capital has created some risk in the system.

“Given housing loans have become such a high concentration on the systems balance sheet and require, particularly for the more sophisticated banks, very limited levels of capital, assessing losses within the housing book are critical to judging the adequacy of capital of Australia’s banks” Wayne Byres, Chairman APRA, Lessons from APRA’s 2014 Tress Test on Australia’s Largest Banks, 7th November 2014

At this stage APRA has no plans to increase capital ratios for banks, but it was a key recommendation in the recent Murray Inquiry report – “Because of their (banks) reliance on off-shore funding markets, the highly concentrated nature of our banking sector and the similarity of business model of most Australian banks.” Banks are essentially all in the same trade with little diversification of lending risk.

ASIC investigation into the use of “interest only” loans. See the full announcement here. The growing proportion of interest only loans has raised concerns regarding the appropriateness of this higher risk lending. Under the current low rates scenario, interest only loans enable borrowers to maximise the amount they can borrow, especially for investment purposes. This increases the amount of leverage and risk. The concern raised by ASIC relates the whether these loans are appropriate in all circumstances.

‘While house prices have been experiencing growth in many parts of Australia, it remains critical that lenders are not putting consumers into unsuitable loans that could see them end up with unsustainable levels of debt”, ASIC Deputy Chairman Peter Kell, Media Release, 9th December 2014

Increased surveillance of lending practices by APRA. This is in response to what it calls emerging pressures in the housing market”. In a statement released last week, APRA confirmed that while it would not increase capital requirements or introduce macro-prudential limits at this stage, it will step up its surveillance of “specific areas of concern”:-

  • higher risk mortgage lending — for example, high loan-to-income loans, high loan-to-valuation (LVR) loans, interest-only loans to owner occupiers, and loans with very long terms;
  • strong growth in lending to property investors — portfolio growth materially above a threshold of 10 per cent will be an important risk indicator for APRA supervisors in considering the need for further action;
  • loan affordability tests for new borrowers — in APRA’s view, these should incorporate an interest rate buffer of at least 2 per cent above the loan product rate, and a floor lending rate of at least 7 per cent, when assessing borrowers’ ability to service their loans. Good practice would be to maintain a buffer and floor rate comfortably above these levels.

(Source: APRA 9th Dec 2014)

Implicit in all of the increased regulatory focus of late is the question ‘what if housing doesn’t always go up?’ This is quite a departure from what is ingrained in our culture – that real estate values only ever go up. But the combination of the threat of tighter global liquidity together with slowing growth in Australia now raises this very possibility. Strengthening the regulatory framework is undoubtedly an important step to take, but its effect will be to slow down the housing market in order to reduce any further risk. Measures to strengthen the financial system and to limit the growth of riskier lending will in effect take the momentum out of the fastest growing part of the market. This action itself could pose a threat to those exposed to the real estate market that are highly leveraged and are relying solely on house price gains.

However, as very highly leveraged institutions at the centre of the financial system, investing in risky assets and offering depositors a capital guaranteed investment, we need confidence that banks can withstand periods of reasonable stress without jeopardising the interests of the broader community (except perhaps for their own shareholders). But what degree of confidence do we want?” Wayne Byres, Chairman APRA, Opening statement to the House of Representatives Standing Committee on Economics 28 Nov 2014

Aussie House Prices and Housing Finance – October 2013

The last time I reviewed the housing market was in February 2013. We were about five (5) rate cuts into this current cycle of eight (8) and house prices had started growing again. Back in February, the growth in housing finance debt was easily narrowed down to housing investors. What’s different now is that it’s no longer just investors driving the growth in housing finance. During 2013 and especially in the latest quarter to October 2013, owner occupier growth has also accelerated. House prices are now growing at 7.6% P/A and housing finance is growing at over 15% P/A.

The aim of this post is to bring together a range of credit and house price data releases from the last few months to get a view on the Australian housing market. I won’t keep you in suspense – based on housing finance data, there is no reason to think that the trend in prices is anything but up in the short-term. Given the historical lags between peaks in housing finance and house prices, it’s also possible that we’ll see house prices grow for much of 2014 across most states.
What’s behind the current growth in housing finance and house prices?

The red arrow in the chart below represents the start of this series of eight (8) interest rate cuts (Nov 2011). The green arrow represents the last housing finance trough (Mar 2011). So yes, housing finance did start to grow prior to the interest rate cuts, likely on the back of speculation of rate cuts to come.

I don’t have any evidence to suggest that there is a causal relationship between interest rate changes and house prices. But there is a reasonably strong correlation between interest rates and house prices (R=-0.75) over the last 30 months (since the interest rate cuts). This is slightly stronger than the correlation over the last 328 months (R=-0.60).

Since that update, house prices have continued to grow, but for the moment are still below recent peaks in the rate of growth;-

Source: ABS 

A review of current house prices

There are a number of different sources for house prices and all differ in what they measure. Below is a summary of the three (3) major sources of house price data in Australia.

Australian Bureau of Stats (data as at September 2013)
The ABS measures house prices of established detached dwellings – but not units or apartments, so it’s not a complete picture of all dwelling prices.

There are two ways I’d like to look at these house prices, firstly, by looking at the annual growth in prices of established detached dwellings.

Based on the latest September 2013 data, annual growth highlights that only Sydney and Perth house prices are growing above the National average. But markets such as Melbourne, Darwin and Brisbane (to a lesser extent) are not too far behind.

Source: ABS 

The picture changes somewhat when you look at the price index at September 2013 compared to the price peak in 2010 and adjusted for CPI. In this case, real house prices at a National level are still below December 2010 peaks by -5.3%.

Source: ABS 

On a state by state basis, in real terms, only Sydney and Darwin house prices have reached new highs (exceeded the highs from 2010);-

Source: ABS 

Most other markets are still well below their respective peaks of 2010 in real terms. In nominal terms, it’s a similar picture. Only Sydney, Perth and Darwin have exceeded 2010 highs. This has been a strong enough result to take the nominal National average higher than its 2010 peak as well.

No matter which way you cut the data, Sydney, Perth & Darwin have been the best performing markets in terms of house prices.

As I mentioned, the ABS only measures prices of established detached dwellings (not units), so I’ll also reference two other major providers to help fill in the gaps.

RP Data (year to December 2013)
RP Data (www.rpdata.com) tracks both unit and detached dwelling prices in each market. Note this is the latest data for December 2013.

The data from RP mirrors the story of the ABS – Sydney and Perth are growing faster than the National average (14.5% and 10% respectively, year on year to December 2013, all dwellings). Growth in Melbourne dwelling prices are not far behind (+8.5%). In this case though, Darwin dwelling price growth is lagging behind the market with +3.3% growth over the last year, with Unit price growth declining year on year by 3.8%.

According to RP Data, growth in the prices for Units has been catching up with House prices over the last year – the 5 capital city aggregate +10% for Houses and +8.9% for Units.

The latest month on month growth data is lower in all markets except in Hobart. The lower monthly rates of growth may not be surprising for this time of year i.e. less activity over the Christmas/NY period (the real test is whether there is a sustained decline in housing finance data in the new year). According to RP, all dwellings prices grew by 1.3% (National) for the month of Dec (versus month prior). Despite house prices growing at 14.5% year on year in Sydney, the month on month growth slowed to +0.74% in Dec.

Australian Property Monitors (APM) at September Qtr 2013
The data provided by APM is also broadly in line with ABS & RP data.

According to APM, house prices grew by +7.8% year on year. This reflects growth in all markets, but with Sydney, Perth and Darwin all leading the way (11.7%, 8.6% and 8.1% growth respectively). Even Hobart recorded strong growth of +5.7%. While still below the National average, growth in Hobart is well ahead of Adelaide, Brisbane & Canberra house price growth.

The quarterly data points to slow-down in house price growth across all markets. The most surprising is the slow-down in Perth house price growth – from +8.6% year on year to 0% growth (quarter).

Growth in unit prices was mixed. The year on year growth at September 2013 was strong overall +5.5%. Sydney and Darwin led the way (+10% and +8% respectively). Markets such as Melbourne, Brisbane and Adelaide were weaker – Brisbane recorded -4.6% decline year on year. On a quarterly basis, only Sydney and Darwin recorded growth in unit prices – which was enough to generate a positive 1.2% growth at a National level. All other markets experienced a decline in unit prices.

There is a reasonably consistent story on house prices across all three sources of house price data. To recap;

  • Sydney has seen the highest rate of growth of dwelling prices of all markets. In real terms, it is only one of two markets to now exceed its 2010 high in house prices
  • Perth house prices continue to grow above the National rate, but this has slowed over a more recent time frame
  • Darwin annual house price growth at September (APM & ABS) was +8.1% and +6% respectively, but again, in the RP December data house price growth slows to 3.3%
  • Melbourne is a bit of a dark horse – prices are growing just below the National average, but are still high in relative terms across all data providers
  • The slower growth recorded by RP over December could be a reflection of seasonal slow-down

Housing Finance – what it says about the next moves in house prices
The month of October was a big month for housing finance, with growth accelerating in most segments;

Source: ABS 

Investment housing finance has been the main driver of growth in housing finance, growing at over 20% in annual terms and accelerating in the most recent qtr to +26%. Growth in investment housing finance represents over 58% of the total dollar growth in all dwellings finance for the year to October 2013, or $17.6b in growth. In contrast, total owner occupier housing finance grew by $12.8b (ex refi’s, annual).

Since the start of this latest round of interest rate cuts, investment housing finance has grown from 41% share of all dwellings finance to 45% share.

Owner occupier activity hasn’t grown as fast, but it’s still growing at a high rate. The only exception is growth in owner occupier housing finance for new homes, which slowed over the recent quarter, but remains at a high level (+14%).

The increase in refinancing of established dwellings over the last quarter is notable. Activity has reached new highs for each month since May 2013. This is quite possibly due, in part, to lenders starting to raise their fixed interest rate mortgages. If borrowers think that rates are going up in the future, they may want to start to lock in lower rates. Alternatively, as house prices have grown, borrowers may be inclined to tap into some of that equity. Some may be restructuring to lower repayments (just to cover all options).

All Dwellings Finance (Total of Investment and Owner Occupier Housing Finance)
Growth in All Dwellings Finance (monthly growth v same month prior year) has reached pre-GFC highs of +20%;-

Source: ABS

Both investment and owner occupier housing finance is contributing to that growth – each segment in more detail later.

Importantly, All Dwellings Finance (ex refi’s) in dollar value reached an all-time high in the latest month of October 2013 exceeding the previous peak of June 2007.

Source: ABS 

Investment Housing Finance
Investment housing finance growth continues to accelerate and it too has reached its pre-GFC peak in growth (+28%);-

Source: ABS

In October, the value of investment housing finance reached an all-time high of over $10b in one month – which was an 8% increase over the month prior (which was also a new high). From the chart below, it looks like investment housing finance has gone ‘parabolic’.

Source: ABS

Owner Occupier Housing Finance

The growth in owner occupier housing finance hasn’t been as strong as investor housing finance, but annual growth is still very high and approaching pre-GFC levels. Growth for the latest month versus same month last year is +16%.

Source: ABS

In dollar value terms, the month of October is only 9% below the all-time high reached in September 2009, which was fuelled by a doubling of First Home Buyer grant.

Source: ABS

The largest part of owner occupier housing finance is the purchase of established dwellings, which has been the main contributor to the growth of owner occupier activity (accounts for $8.9b of the $12.8b growth owner occupier finance growth).

Owner occupier finance for new homes and construction both contributed to growth (+$3.8b) but growth in finance for new homes is slowing (red line), while construction finance for owner occupiers has lifted in recent periods (blue line):-

Source: ABS

The growth in the volume of owner occupier housing finance commitments was starting to slow during August and September, but has continued to bounce back in October. This chart highlights that whilst growth is on par with pre-GFC growth, the total number of owner occupier housing finance commitments is still well below its peak;-

Source: ABS

The slower growth of the last 3 months could be viewed as slightly bearish news. If any metric was going to turn first, it would most likely be volume (as prices rise, more people may become priced out of the market, yet total value growth could ‘mask’ any change in underlying demand) – and we saw this dynamic play out in 2006/07. Volume growth is still high and we’ll have to keep watching this metric to see if/when it changes.

State by State Overview – Investors and Owner Occupiers
On a state by state basis, there are a couple of key markets that are leading the growth in housing finance.

Source: ABS

As we saw earlier, investment housing finance accounts for the majority of the dollar value growth over the last year. Most of the growth in investment housing finance is coming from one state – NSW.

The growth in owner occupier financing is a little more evenly spread across the larger states, but WA still accounts for the largest share of that growth.

Owner Occupier activity by state
There are a couple of interesting points about the state by state owner occupier finance data. Note that the slight difference in the National growth rate is due to using ‘original’ not seasonally adjusted data – seasonally adjusted data is not avail on state by state basis.

Source: ABS

Across most of the bigger states, there has been a marked acceleration in the growth of the value of owner occupier finance over the October quarter (versus same qtr LY) – in NSW, VIC, QLD, even SA and TAS.

WA has generated the largest annual growth in dollar value (+$4b growth or 30% of the annual growth), yet the state only accounts for 15% of total Owner Occupier housing finance ex refi’s Nationally. But it’s one of three states that saw growth slow somewhat in the last quarter, albeit from/to very high levels. I’ve written about some interesting real estate indicators from key WA mining towns in another post. It appears some steam is possibly coming out of the WA mining markets, so it will be interesting to see how this develops in 2014 and what it means for the broader WA market.

The other notable slow-down in owner occupier housing finance was in NT.

Volume (actual number of commitments) is also growing in line with value growth at a National level, but with a few state differences. That said, over the most recent few months, the growth trend in the number of commitments appears to slow in WA, QLD, SA, NT and ACT. Again, there could be seasonal factors at work (clearance rates slowed at the same time).

Owner Occupiers – First Home Buyer’s (FHB) v Non-FHB’s
Owner occupiers can be broken down into two segments – First Home Buyers (FHB) and non- FHB’s. There are quite a few states where FHB activity has declined over the last year – NSW being the most notable.

Source: ABS

In NSW, the growth in non-FHB housing finance was almost completely offset by the decline in FHB activity, resulting in much lower overall growth (2% in NSW versus 6% for the National average). The trend in NSW is striking – since early 2013, the growth in non-FHB commitments appears to accelerate, whilst the number of FHB commitments halved over the last year.

Source: ABS

There has been much talk about how FHB’s are increasingly priced out of the market, especially in Sydney. The average loan size for FHB’s in NSW has reached all-time highs over the last 6 months and is currently at its third highest point.

In other markets;

  • FHB activity in QLD has almost halved over the last year
  • In WA, SA and TAS, FHB activity has grown at 22%, 23% and 17% respectively – likely in response to changes in first home owner grant schemes over the last year.

Here is a snap-shot of the various state-based FHB grant schemes;-

State Activity
NSW
  • FHOG* – New Homes – $15,000 for new home or to build own home (will reduce to $10k in 2016)
  • Exemption of transfer duty on new homes (valued up to $550k)
  • New Home grant scheme $5,000 for purchase of new homes, homes off the plan or vacant land
VIC
  • FHOG New Homes up to $10,000 (limited to $750,000 value)
  • Stamp duty reductions – new & established homes
QLD
  • Great Start Grant – $15,000 to buy or build a new home
SA
  • FHOG – New Homes (from 15/10/12) $15,000
  • Housing construction grant (15/10/12 – 31/12/13) $8,500
  • Off-the-plan-concession (stamp duty) – Purchase of off-the-plan-apartment $21,330
  • FHOG – Established homes (22/11/12 – 30/06/14) $5,000
WA
  • FHOG – New Homes – $10,000 (increased since 25/09/13)
  • FHOG – Established homes $3,000
TAS
  • FHOG – $7,000
  • FHOG – Buy or Build a new home $23,000
  • First Home Builder Boost – $7,000
ACT
  • FHOG – New & substantially renovated properties $12,500 (after 01/09/13)
NT
  • FHOG – established home in an urban area $12,000
  • FHOG – new/construction $25,000
  • Value of property capped at $600,000

*FHOG – First Home Owners Grant

Some state grants schemes have been more successful than others (based on the growth of FHB commitments). Despite the focus on new home first home buyer incentives, its interesting that growth in housing finance for new homes is slowing down (from the summary chart on housing finance) from +28% to +14% growth. This is being driven by slowing growth in NSW, VIC, QLD, ACT and most notably in WA and NT. In WA, owner occupier finance for new homes has gone from +30% annual growth to -10% decline in the latest quarter. Note from the table above that the incentives for the purchase of new homes in WA (for FHB’s) were just increased in September (as well as in ACT).

Investment housing by state
Lending growth for investment housing has accelerated in the latest quarter across most states, with the exception of WA and ACT.

Source: ABS

Whilst the WA figures aren’t significantly different between the annual and quarterly growth rate, it is consistent with a similar slow-down in owner occupier finance growth experienced in that state.

In the ACT, investment housing finance reached an all-time high in June 2013 and has drifted off ever since and is now below the 12mth moving average.

Some other notable points on investment housing finance;

  • NSW reached an all-time high in the latest month (October 2013)
  • Victoria and NT exceeded its all-time high in the latest month as well (previous was May 2010)
  • QLD, SA and TAS are still well off from their all-time highs (and well below the National average), but are trending up nonetheless

Where to next? What the relationship between housing finance and house prices tells us…
There is a strong correlation between house prices and all dwellings finance ex refi’s (R=0.963, a correlation of 1.0 is a perfect positive correlation).

Source: ABS

Looking further at the relationship between housing finance and house prices highlights that there is a lag between changes in housing finance and house prices. Using ABS house price data and All Dwellings Finance data (ex refi’s) there is on average a nine (9) month lag between a peak in housing finance and any decline/stall in house price growth. Although the average is 9 months, the range is between 6 and 12 months. This average is based on seven (7) periods where All Dwellings Finance and the ABS house price index declined since 1986.

Using this crude forecasting measure and given that All Dwellings Finance is currently on its highs, it’s possible that we will continue to see house price growth throughout most of 2014. I’ll be looking for a peak in housing finance and at least 3-4 months of sustained financing declines before I consider the possibility of house price declines (at a National average level).

That said, not every state is in the same situation. The markets where housing finance is on its highs:

  • NSW – both investor and owner occupier housing finance $ value is on its highs (has reached all-time highs)
  • VIC – investor housing finance leads the way and owner occupier housing finance is very close to its highs. The total of both reached an all-time high in October 2013
  • QLD – both investor and owner occupier housing finance $ value has reached an intermediate high (but are well off the all-time highs – this point doesn’t matter for relative house price growth)
  • TAS – the total of investor and owner occupier housing finance has started to recover (mostly driven by owner occupier housing finance), reaching an intermediate high in October 2013 (last seen in Mar 2010)
  • NT – investor housing finance is on its highs and this is helping to drive total housing finance near all-time highs

Until there is any evidence of sustained decline from these intermediate or all-time peaks in housing finance, house prices are likely to grow for most of 2014 in these markets.
It’s less clear in SA and WA. All dwellings finance in both of these markets is off its high, but still elevated. Both markets peaked in May 2013 and are now -4% and -8% respectively below that peak as of October 2013. If housing finance continues to decline from the May 2013 peak in these two markets, then house price growth may continue for (approx.) the next 4 months before it either stalls or starts to decline (depending on the size of the change in finance).

In ACT, housing finance is approx. 15% below its peak reached in May 2013. House prices in this market will likely come under pressure in 2014 as long as this trend continues. The latest quarterly data from the ABS has ACT house prices at -1.2%, although the more recent RP Data has Canberra house prices still growing at 3.3% (annual) as at the end of Dec 2013.


Australian house prices, housing finance and the credit impulse

The ABS has released its House Price Index for the Dec 2012 quarter. 

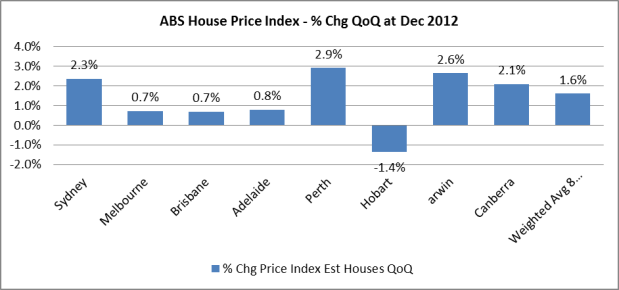
As expected, there was a reasonable bounce back in house prices in the last quarter of 2012 of +1.6% versus the prior quarter.  The Sept 2012 qtr was revised lower in this round of data. 

The Dec qtr was the strongest since the First Home Buyer-fuelled growth in house prices during 2009. The National House Price Index now sits at only 3% below its all-time high.

image 1 house price % chg

Source: ABS

Despite this solid result, there is still some weakness across the states, with only two ‘major’ states posting above national average gains in house prices – Sydney & Perth.

image 2 house price changes by state

Source: ABS

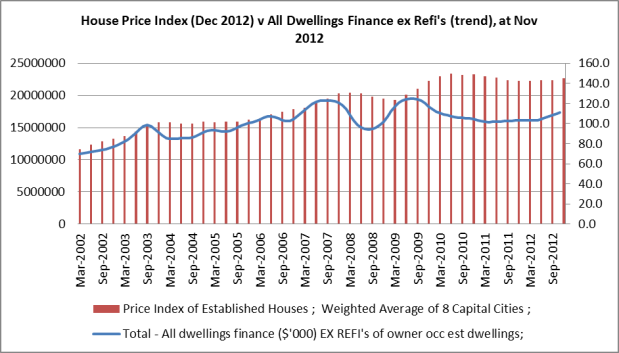
One of the key drivers of house price growth is the availability of & willingness to take on more debt, or accelerating credit.  There has been growth in housing lending finance for quite a few months now.  Although I haven’t proven a correlation between debt & house prices here, you can see that the two move together (it makes sense that they would).

image 3 house price versus lending

Source: ABS

Growth in lending continues to hold up the housing market. Based on the current data, it appears that we aren’t going to see any movement down in house prices yet. Interestingly, we are currently 3% below the peak in house prices, and yet 11% below the peak in lending. Despite lower lending, prices remain high.

At Nov 2012, total housing lending has grown by over $10b (incl refi’s), or 4%, year on year. More specifically, its investment lending that is driving the growth in overall housing finance lending:

  $ Growth (MAT Nov 12 v MAT Nov 11) Growth %
All Dwellings Finance $10,397,895,000 +4.39%
Investment Housing Finance $4,929,143,000 +6.25%
All Owner Occ Finance Ex Refi’s $2,822,5546,000 +2.51%
Owner Occ Refi’s $2,646,206,000 +5.82%

Source: ABS, seasonally adjusted

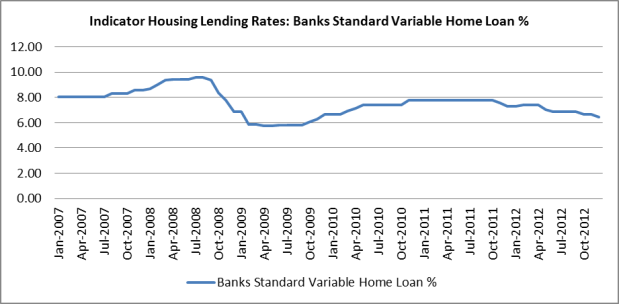
One of the key drivers for this growth in housing finance is likely to be the recent interest rate cuts.   Since the end of 2011, the RBA has consistently cute rates in order to stimulate growth in lending. 

image 4 indicator interest rates

Source: RBA

This appears to have had/is having the desired effect – on house prices anyway.

Investment Housing Finance

There has been a turnaround in investment housing finance since approx. Feb 2012.  Since then, growth has spiked quite dramatically, especially after a period of low/flat growth throughout 2011. 

image 5 investment housing

Source: ABS

The rolling 12 month growth for investment housing lending is now in positive territory.  Month on month for Nov 2012, it has grown by over 15.5%. Investment housing finance accounts for approx. 1/3 of total housing lending value.

Investment mortgage debt growth has been accelerating since late 2011.  This is an important distinction when thinking about house prices.

image 6 investor credit impulse

Source: RBA, ABS, The Macroeconomic Project

Despite the accelerator being in negative territory throughout 2012, it has been moving in a positive direction, creating a stimulatory effect (growth in the growth of debt stock = credit is accelerating and the addition of new credit is what stimulates asset prices).

Unfortunately, this chart is a little backward looking (only up until Sept 2012, due to GDP lag). There has been a slight pullback in the accelerator in the latest month only (Sept ’12).

The recent up tick in the rate of growth in real investor mortgage lending suggests that the accelerator may continue to rise for the Dec 2012 quarter.

image 7 real investor lending growth

Source: RBA, ABS

 My sense is that investors have responded to the interest rate cuts – just given the timing of rate cuts and the way in which credit growth has starting growing again. What would be really interesting to understand is how these investors are funding their purchases.  Are they interest only loans? It would also be interesting to know what proportion are local v. overseas investors.

Owner Occupied Housing Finance

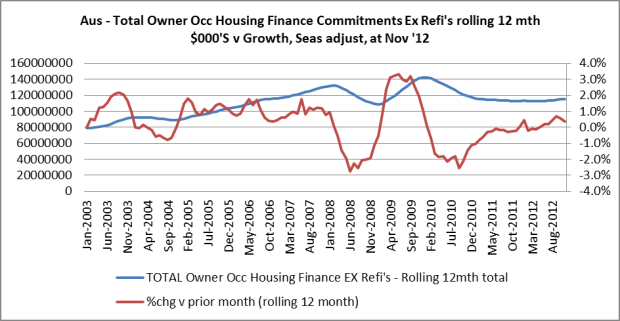
At first glance, it appears that owner occupiers are also helping to move house prices higher.  Growth in credit has continued to improve and is now in positive territory (ex refi’s).  The uptick in growth from Feb 2012 suggests that interest rate cuts have had some effect.

image 8 owner occ lending

Source: ABS

It’s interesting to break down “owner occupier” lending activity into its parts to understand the picture a little better;


$ Growth (000’s)

(Yr on Yr Nov ’12)


Growth %


Share %

All Dwellings Finance

$10,397,895

+4.39%


Investment Housing Finance

$4,929,143

+6.25%


All Owner Occ Finance Inc Refi’s

$5,468,752

+3.46%

100%

Owner Occ – Construction of Dwellings

$640,511

+4.01%

10.2%

Owner Occ – Purch of New Dwellings

$1,030,421

+13.05%

5.5%

Owner Occ – Purch of Other Est Dwellings

$1,151,614

+1.3%

55%

Owner Occ  – Refi’s of Est Dwellings

$2,646,206

+5.82%

29.4%

 Source: ABS, seasonally adjusted

The biggest part of owner occupier lending is for the purchase of established dwellings – this activity has grown annually by far less than the average of all dwellings finance at only 1.3%.  The growth in the ‘headline’ number for owner occupiers has equally come from the smaller segments – construction and purchase of new dwellings, as well as refinancing.  The growth in lending for the purchase of new dwellings is mostly driven by changes to first home owner grant initiatives (mostly focusing on the purchase of newly constructed homes). Refinancing has also continued to grow, but note that this does not contribute to house price growth – no sale transaction has actually occurred.

The main point is that single biggest part of the market, owner occupiers purchasing established dwellings, is growing at the lowest rate of growth. 

The acceleration of debt for owner occupiers shows a very different pattern to that of investor lending.  Broadly speaking, owner occupier lending is growing, but that growth has been reasonably constant (relative to the size of GDP) over the last year, so its potentially not stimulating house price growth in the same way that investor borrowing is.

image 9 owner occ mortgage impulse

Source: ABS

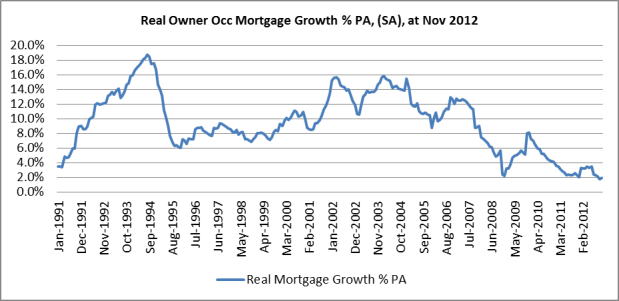
Again, we are lagging in this data above due to GDP data. But the growth in real owner occ lending (up until Nov ’12), suggests that we’ll see a further weakness in the credit accelerator for owner occupiers.  The rate of growth in real owner occupier lending continues to slow down – its now reached a low of 1.9% and is on its lows.

image 10 real owner occ mortgage growth

Source: RBA, ABS, The Macroeconomic Project

Whilst growth for both investor and owner occupier housing lending has been slowing down, total mortgage debt outstanding as a % of GDP is still close to its highs – currently 84.5% versus the Mar 2010 high of 87.2%.

image 11 housing debt to gdp%

Source: RBA, ABS

On the whole, I would argue that interest rate cuts have been less successful in stimulating demand for more debt for owner occupiers buying established dwellings.  This could differ slightly on a state by state basis.

Owner occupiers, excluding new home/construction lending, have not/are not participating to the same degree as investors in this ‘interest rate cut rally’. Housing investors appear to have taken advantage of lower interest rates to buy properties and this has been helping to drive house prices higher.

Credit Accelerators – Other Sectors

Further results of the credit accelerator calculations suggest that interest rate cuts have also done little to stimulate the credit impulse in the broader economy.

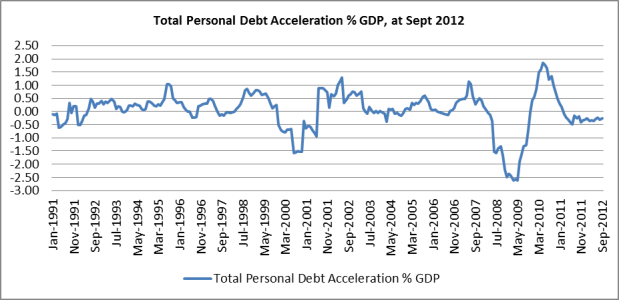
The personal debt credit impulse remains in neutral.

image 12 personal debt credit impulse

Source: RBA, ABS

Although, the latest month of real personal credit growth (Nov ’12) suggests that there could be some improvement in the accelerator during the last qtr of 2012. 

image 13 real person debt growth

Source: RBA, ABS, The Macroeconomic Project

This level of declining real personal credit suggests that consumers, on the whole, have been cutting back.  This personal debt is being paid down at a pretty constant rate, which is consistent with the zero credit impulse. Personal debt to GDP has continued to fall since late 2007.

image 14 total personal debt to gdp%

Source: RBA, ABS

It appears that consumers have taken advantage of interest rate cuts (via an increase in disposable income) to pay down their personal debt, rather than take on more debt. We are seeing some of this weakness show up in areas of spending such as retail sales.  But they are barely making inroads into paying down their mortgage debt.

Of a larger concern is the change in the business credit impulse. This is quite a ‘noisy’ data set, but I think it shows a further slowdown in business lending/borrowing.  If you consider that new credit issued=new spending in the economy, then a fall in new credit issued will/should correlate to a fall in spending.  This is bad news for the economy and speaks volumes about the real state of business confidence. Consider that this is happening with a backdrop of low interest rates.

image 15 business debt acceleration

Source: RBA, ABS, The Macroeconomic Project

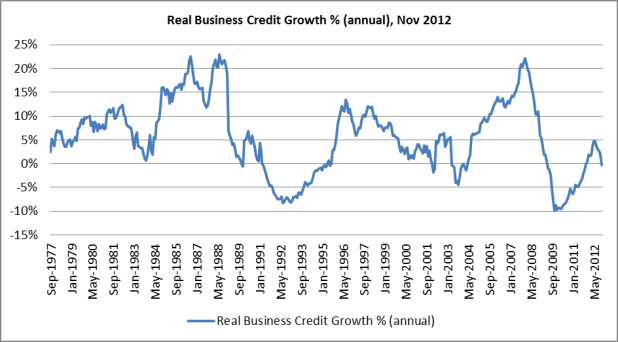
The growth in real business credit further suggests that the business credit accelerator will continue its decline into the last quarter of 2012.

image 16 business real credit growth

Source: RBA, ABS

Growth in business debt in real terms has gone from 5% in June 2012 to zero % in Nov 2012. Business in Australia (I’m referring to manufacturing & retailing) has been struggling with high exchange rates and competition with cheaper overseas imports & online retailers.  The pull back in debt acceleration suggests that business are preparing to further slow their growth and are becoming more uncertain or unwilling to take on debt to fund investment or expansion.  This may not bode well for future employment & income growth.

Just to put this into perspective, business debt outstanding has fallen since the GFC, but has stabilised at around 50% of GDP. So in relative terms, this is an important group from the perspective of stimulating spending & growth in the economy.

image 17 total business debt to gdp%

Source: RBA, ABS

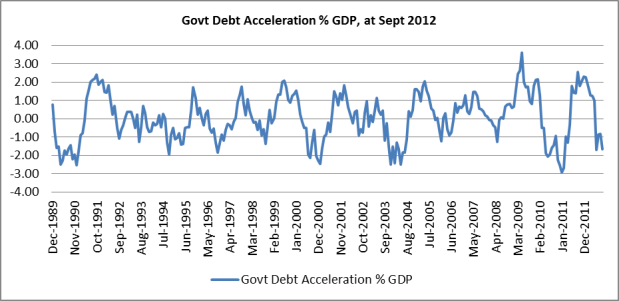
The government credit impulse is also cause for concern – in the sense that it is moving down and not stimulating spending/income. I’m not suggesting that the government should be deficit spending at this stage.

image 18 govt debt acceleration

Source: RBA, ABS, The Macroeconomic Project

The credit impulse for government has trended down since mid-2011.  There has been a further pull-back in new credit/spending by the government (no big news there given we had a government committed to a budget surplus) in the most recent data.  This is also evident in the real government credit growth rate.

image 19 real govt credit growth

Source: RBA, ABS

Only the government sector has grown debt to GDP in the last few years – in an effort to stimulate our economy during the GFC. At less than 10% of GDP, government debt is still quite low.

image 20 govt debt to gdp%

Source: RBA, ABS

Overall, I think the credit impulse data is pointing to a potential slow-down in the Australian economy.  Interest rate cuts have not stimulated the credit impulse for owner occupiers, personal lending or business lending – at least not in the same way as the investor housing credit impulse. Without growth in the credit impulse, its not likely we’ll see growth in spending in the economy.