On the 1/11/11, the RBA Board commenced what has now become a series of eight (8) interest rate cuts, reducing the benchmark rate from 4.5% to 2.5% (as at Oct 2013). These rate cuts came on the back of a relatively strong AUD, weakening commodity prices, falling Terms of Trade, a softening in the domestic labour market, weaker house prices and overall weakening domestic demand as evidenced by lower than expected CPI.
Since the Oct 2012 board meeting, it’s clear the RBA has recognised the approaching peak in resources investment i.e, the “mining capex cliff”. In its own words “it will be important that the forecast strengthening in some other components of demand starts to occur.” Emphasis added by me. Those “other components of demand” include business, personal & housing spending/investment. According to the RBA, the aim of lower interest rates has been to encourage sustainable growth in the economy consistent with achieving the inflation target and to rebalance growth with a combination of depreciating exchange rate and lower interest rates to stimulate non-mining investment.
So, two years and eight rate cuts later – is there traction in the economy? Is ‘rebalancing’ underway? I want to look at this through the lens of the credit impulse in Australia.
Demand for Credit
Recently, the RBA released its Lending & Credit Aggregates for Sept 2013.
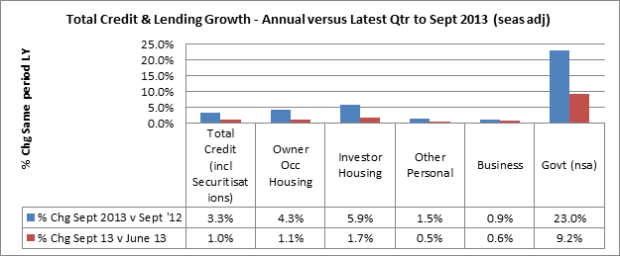
Source: RBA
Besides the growth in Government borrowing, Investment and Owner Occupier housing finance have been the main drivers of growth in total credit. It’s easy to get caught up in % changes, but these two areas of credit alone contributed 87% of the actual dollar growth (ex Government) in all lending over the last year.
The very big concern is the fact that Business credit growth is low. Business credit represents 34% of total credit at Sept 2013, but only accounted for 9% of the actual dollar growth in credit over the last year. Other Personal credit has similarly underperformed.
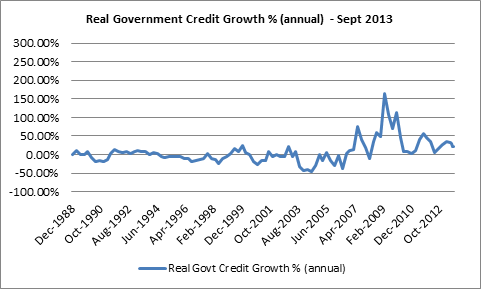
Government credit (not included in Total Credit) has seen strong growth.
The Credit Impulse
Growth in credit is the usual way to relate developments in credit with developments in the economy. Possibly a more insightful way to measure this is by growth in new credit issued relative to the size of the economy. From www.clearonmoney.com, if someone is borrowing a fixed amount each month, then spending is constant (the assumption is that borrowing=spending). There is growth in credit, but no growth in spending because the amount borrowed is the same each month. The credit impulse would be zero. If that person borrows more each and every month, then new credit is accelerating and result is that spending is also likely to grow. In this case, the impulse is increasing (there is a positive slope to the line). This perspective follows the change in the flow of money and credit, not the stock. The above chart/table “demand for credit” is the % change in stock.
Total Private Credit Impulse
Below is the estimated credit impulse in Australia for total Private credit comprising Business, Personal and Mortgage credit. It’s calculated by taking the change in new credit expressed as a % of GDP for that quarter. Whilst I have credit data up to Sept 2013, I only have GDP up to June 2013.
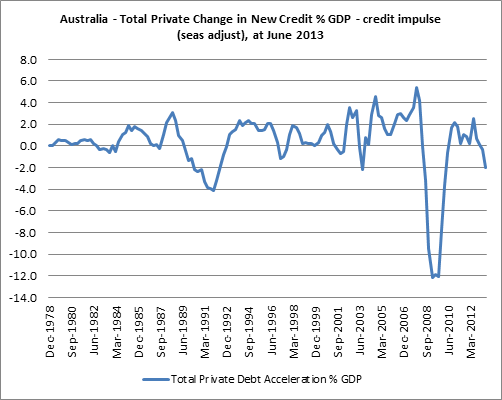
Source: RBA & The Macroeconomic Project
The slope of the line is what counts and since July 2012 the slope has become negative, despite eight (8) interest rate cuts.
Total Private credit has been growing (in nominal terms) but at a decreasing rate. Between June 2012 and June 2013 the growth in new credit has been getting smaller as a % of GDP. For example, new credit grew by $91b between June 2012 and June 2011, but new credit only grew by $61.4b between June 2013 and June 2012. Therefore the change in new credit is -$29.7b or -2% of GDP – a negative credit impulse at June 2013.
To keep funding new growth, new credit needs to grow by an increasing amount.
Source: RBA, The Macroeconomic Project
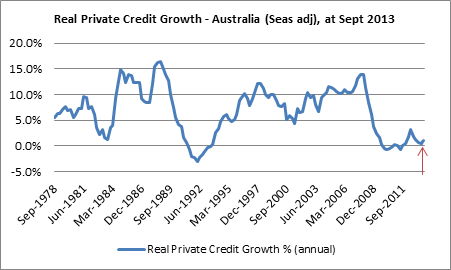
In terms of trend change, real Private credit growth has started to increase again since July 2013 – the red arrow on the chart above. We’ll need to await Sept 2013 qtr GDP figures to understand the size of the impulse.
So with a negative credit impulse, we should have seen a decline in spending in the economy. But the other component to view together with the Private credit impulse is the Government credit impulse.
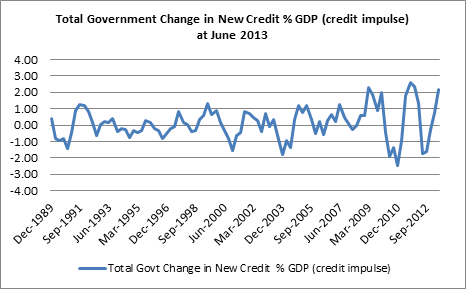
Source: RBA, The Macroeconomic Project
Up until June 2013, the Government credit impulse has been strong – as witnessed by the steepness of the curve (chart above). When you compare the change in new credit as a % of GDP (the actual impulse), the positive Government credit impulse of 2% of GDP counteracts the negative -2% print of the Private credit impulse. You could argue that growth in the economy has been held steady by Government spending.
But during July – Sept 2013, real Government credit growth looks to be slowing down again with quite a substantial drop between July & August 2013. Luckily, the growth in Private credit that we saw above may counteract the Government slow-down in this latest Sept 2013 quarter.
Source: RBA, The Macroeconomic Project
Looking at the Private and Government credit impulse can provide a general view over growth in the economy. One way to look at the effect on the economy is to look at recent trends in GDP growth;
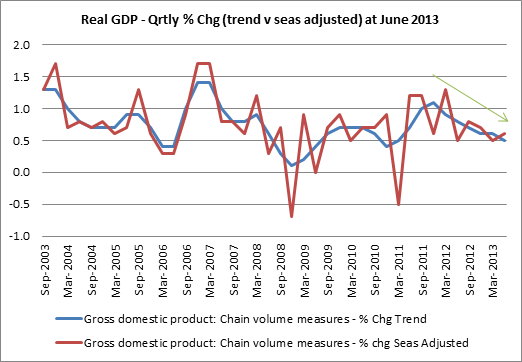
Source: ABS
Quarterly GDP growth ‘peaked’ around Dec 2011 (trend) and has continued to slow since then. This isn’t the lowest growth environment that we have been in, but the trend in growth in real GDP indicates that the economy is not ‘rebalancing’ after eight (8) interest rate cuts. This is consistent with the low credit impulse in the economy.
But not all pockets in the economy are performing equally. Breaking down the credit data provides some insight as to the areas that have and have not (yet) responded to rate cuts.
Business Credit Impulse
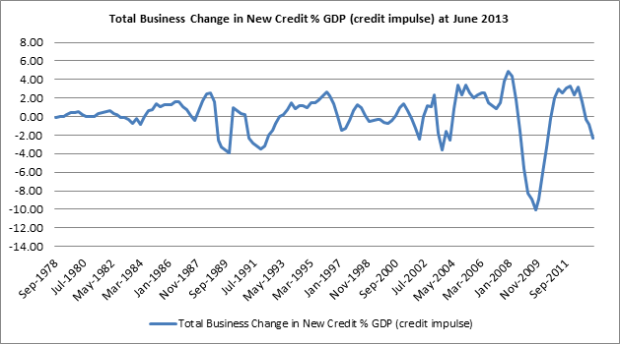
The business credit impulse has been in a down trend since June 2012 qtr and this is the most concerning insight in this study.
Business credit is the second largest area of total credit behind owner occupier housing finance so it has a far reaching impact on the economy. Since Dec 2011, the Business credit impulse has gone from +3.3% to -2.3% of GDP.
Importantly, business investment is the engine of the economy. If business is investing in new technology or additional capacity, then this likely to drive future employment and income growth. This is an important source of the RBA’s sustainable economic growth.
Source: RBA and The Macroeconomic Project
Growth in real Business lending has been slowing down since June 2012 and started declining (year on year) around March 2013. Make no mistake, the Business credit impulse has been by far the largest contributor to the total Private credit impulse and growth of new credit for Business represents a larger % of GDP than growth in new credit for Mortgages. The performance of the Business credit impulse has shifted dramatically over this time period – as you can see from the chart. Since the RBA started cutting rates at the end of 2011, the Business credit impulse has gone from positive to negative, not the other way around.
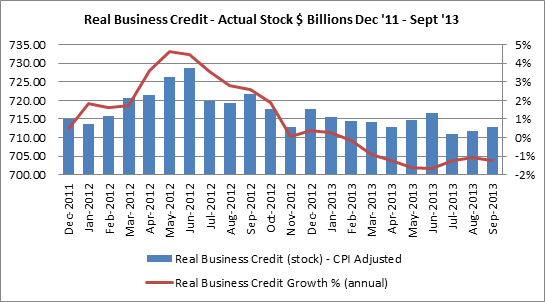
Real Business credit growth has been zero or negative since November 2012;

Source: ABS, The Macroeconomic Project
This means that total outstanding Business debt has been getting smaller – more debt is paid down than new credit is raised.
Source: RBA, The Macroeconomic Project
As you can see from the chart above, the last 3 months of growth suggest a slightly improving Business credit impulse for Q3 2013.
Despite eight (8) interest rate cuts, total Business credit has not grown, and in fact has become smaller as a % of GDP – from 62% in 2008 to 47% in June 2013. The impact of this deleveraging is contraction. The only upside is that business will be in a better position to invest should (when) demand conditions pick up.
These next two charts provide some further context about the current business environment – non-mining profits falling as a share of GDP and even mining profits have stopped accelerating as a % of GDP. Business profits have been squeezed and this is showing up (on aggregate) in cost cutting (see recent employment reports) and what appears to be a reduced appetite for debt/investment for future growth.

This is another view of business investment – by industry sector. Share of business investment in most industries, with the notable exception of mining, is declining. This is exactly the situation that the RBA is aiming to ‘rebalance’ given the forecast for mining investment to slow.
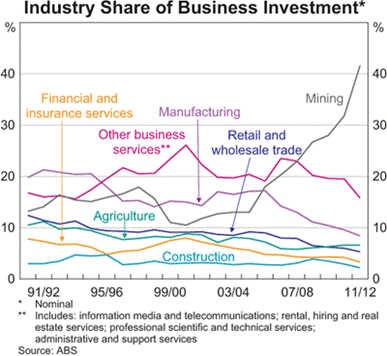
The NAB Monthly Business Conditions report has shown that excess capacity continues to plague the economy across multiple sectors (including mining). There is clearly no reason for business (on the whole) to invest in building capacity;-

The one thing that immediately jumps out to me on these last two charts is the discrepancy between the growing share of Mining investment and the low and falling capacity utilisation in Mining.
The other important factor affecting business (exporting ones) is the exchange rate. The aim of the RBA has been to rebalance growth through a combination of a lower $AUD and lower interest rates. Despite the spike down in 2012 (probably more due to speculation of US FED tapering its QE program than interest rate differential), the exchange rate has remained fairly high. The benefit of a lower exchange rate is that exports become more competitive – which should fuel higher investment and employment locally. It also makes imports more expensive, possibly helping locally manufactured goods to compete domestically, but increasing costs of inputs priced in USD eg fuel.

Overall trading conditions continue to be challenging and business has not been investing. In the short-term this does not paint a positive picture for rebalancing economic growth.
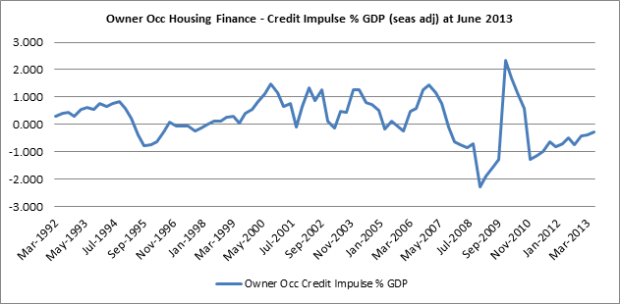
Housing Finance Credit Impulse
This contrasts with the acceleration in mortgage credit growth, especially for Investor housing finance, during this recent rate cut period. There appears to be an increasing disconnect between the relatively weaker underlying business conditions and say, the strength of the housing market.
Since Dec 2011, the mortgage credit impulse in Australia has gone from -2% to -0.09% of GDP at June 2013. The high point was May 2013 at 0.33% of GDP. Clearly a far smaller impact than the Business credit impulse.

Source: RBA, The Macroeconomic Project
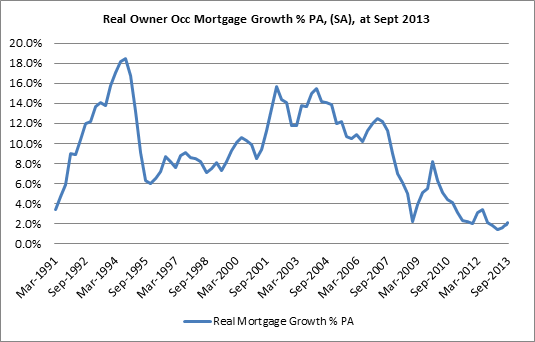
Whilst there is appears to be a slight pull back in the latest months to June 2013, the growth in new mortgage credit (not as a % of GDP) appears to hit a new high in Sept 2013. This is also reflected in the accelerating rate of growth in total real mortgage lending (chart below) – yes that small blip at the end of the chart;

Source: RBA, The Macroeconomic Project
At this level, we can start to ponder where the main effect of the Mortgage credit impulse is felt. The effect of rising mortgage debt and a rising mortgage impulse (rising faster than housing supply) could be seen in economic growth, but is likely to show up more directly in a change in house prices.
This doesn’t mean that there aren’t benefits from a GDP perspective. These benefits might include transaction costs based on the exchange of dwellings – stamp duty, solicitor fee’s, realtor fee’s etc. Rising house prices can signal the potential for new supply requirements. Construction of new dwellings would have a far reaching economic growth impact through higher employment, income etc. The final way is through higher asset prices – and the ability to use equity to fund more spending. But few scenarios here relate the growth in debt to growth in the future earning capacity of the Australian economy.
Most of the recent lift in the mortgage credit impulse is due to Investment lending. The steepness of the Investor credit impulse curve shows just how strong Investors have been in this market relative to Owner Occupiers.
Since the Dec 2011 qtr, the credit impulse has moved from -1.3% of GDP to +0.17% of GDP in June 2013. It reached a high of 0.7% of GDP in Jan 2013. Again, this is a far smaller impact relative to the Business credit impulse.

Source: RBA, The Macroeconomic Project
Investors have been leading the way during this spate of interest rate cuts, and whilst the chart above shows momentum stalling, the growth in new credit between July & Sept 2013 has accelerated again. See below growth in real Investment housing credit;

Source: RBA, The Macroeconomic Project
There has been far more gradual growth in the Owner Occupier credit impulse (below). Despite a negative credit impulse, the slope is positive and that’s the important point. Since the start of rate cuts in Dec 2011 the impulse has improved from -0.8% to -0.27% of GDP in June 2013. The strength in the Investor-led credit impulse has helped to make up for the weaker, but improving, Owner Occupier credit impulse;
Source: RBA, The Macroeconomic Project
Growth in real Owner Occupier financing has also grown fairly consistently since Feb 2013 and the latest 3 months of data suggests that the credit impulse is likely to continue its modest improvement into the Sept 2013 qtr.
Source: RBA, The Macroeconomic Project
What it is also saying is that owner occupiers have been quite late to the party on housing.
Personal Credit Impulse
Personal credit has seen a recent uptick in activity which is a positive sign for consumption spending growth in the economy. Since Dec 2011, the Personal credit impulse has gone from -0.3% to +0.2% of GDP. A smaller effect but it will impact spending growth nonetheless.
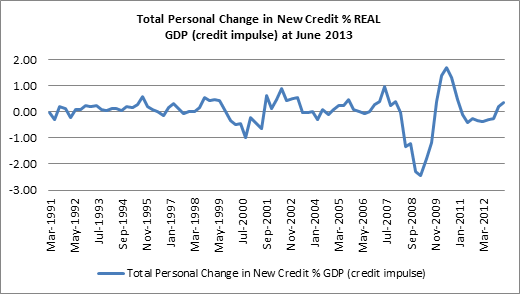
Source: RBA, The Macroeconomic Project
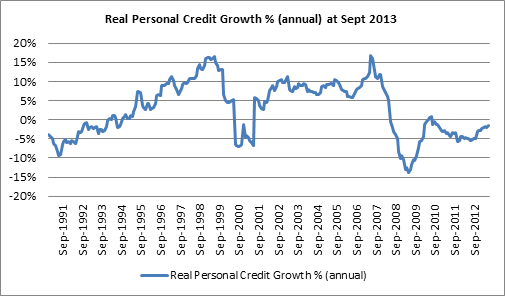
Without a doubt, there has been an improvement in rate of growth. But the improving credit impulse can be related back to a slow-down in the decline of real personal credit growth – note the chart below. Current growth is a far cry from the growth in personal credit pre-2008 of anywhere between 5% and 15% growth.
Source: RBA, The Macroeconomic Project
In the latest months from July to Sept 2013, real personal credit declined by 1% each month – which is an improvement over the June result of -2%.
The stock of outstanding Personal debt has fallen from a high of 13% of GDP to 9% of GDP in the June 2013 qtr.

Source: RBA, The Macroeconomic Project
The trend is improving but it’s not exactly a ‘snap-back’ rally in personal credit growth. Its also possible that some of the lending traditionally called ‘Personal’ may now be accounted for in mortgages via redraw and offset facilities.
But with household mortgage debt is back near its highs (84% of GDP), a weak labour market (PT growth over FT growth) and wage growth slowing, its no wonder Personal credit growth is low.

Unless one of these constraints is removed/reduced, personal credit growth is likely to remain subdued.
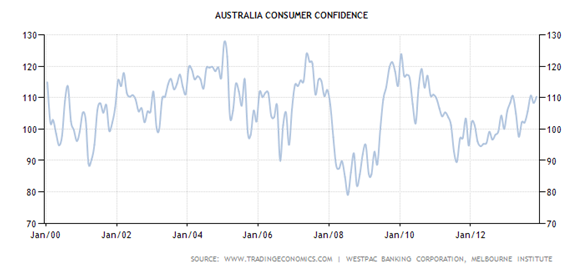
But counteracting this data is the improving consumer confidence index. Together with the slightly improving personal credit impulse, it could be signalling a shift in consumer attitude back to greater consumption. If we see improvements in the labour market, then spending and confidence are likely to improve further.
There have been two key drivers of the credit impulse in Australia over the last six months;
- the negative performance of the Business credit impulse, &
- the positive performance of the government credit impulse
The impact of an improving Mortgage & Personal credit impulse has not been enough to counteract the negative Business credit impulse. Several points about this:-
- Its been a lucky co-incidence that Government borrowing has helped to stave off the negative impact of the Business credit impulse. But with the Liberal government committed to bringing the budget back into surplus, Government may not be a source of spending growth in the future.
- In a later post I’ll highlight that the Mortgage impulse and the resulting impact on house prices, does not reflect a broad-based uplift in housing – which is probably why the mortgage impulse hasn’t had a more influencing effect. This is really a much bigger issue. The effect of an improving mortgage impulse will likely stimulate house prices – but is it big enough to rebalance growth in the economy? As more established houses are sold at higher prices, more debt is created but this debt accumulation isn’t an investment in the future prosperity of the economy.
- The real issue for our economy is the contraction of business activity ie via investment & cost cutting – in response to slack/capacity in the economy. Why is that? Demand for debt (& therefore spending ability) seems constrained apart from investment housing. The shift in interest rates hasn’t moved the credit impulse in a proportional way. Accumulation of debt, together with income, has been a source of spending growth in the past. So do we now have our fill of debt?
The huge fear is that as a result of lower interest rates, we’ve only managed to see rising house prices, more debt, little/no improvement in business investment and therefore no change or improvement in economic growth prospects. If business isn’t investing in expanding capacity or improving competiveness (beyond reducing costs) then the RBA will be hard-pressed to achieve its rebalancing.
